Sankey
This page describes how to set up and configure the Sankey component.
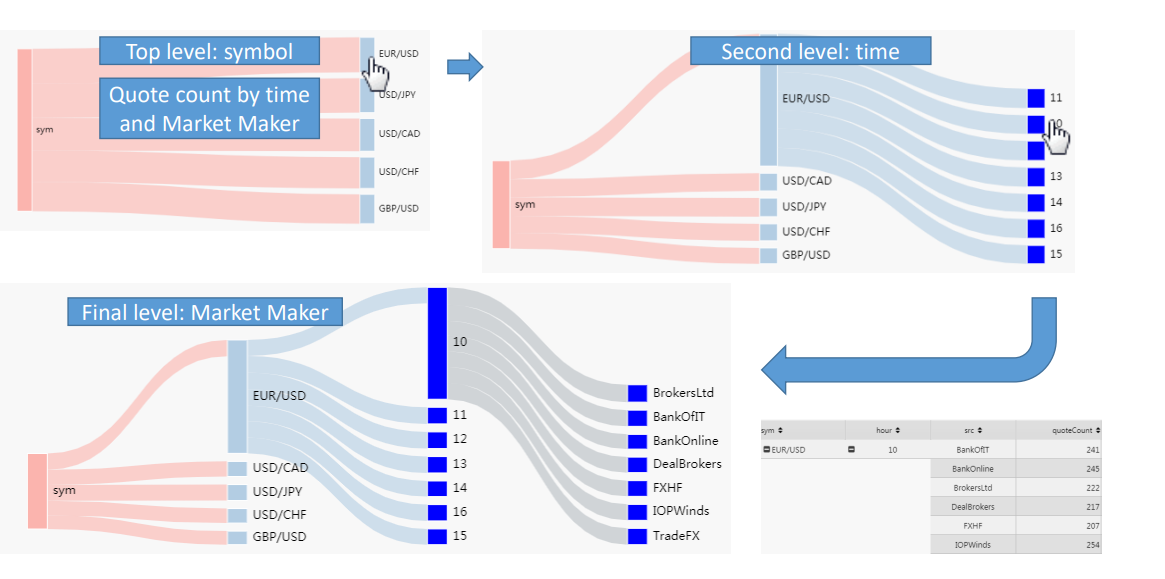
A Sankey chart is a flow diagram where the width of the flow is proportional to the rate, as illustrated below.
Set up a Sankey
To set up a Sankey component, click-and-drag the component into the workspace and configure the following:
Refer to Sankey properties described in the next section for details on additional properties.
Sankey properties
The following sections provides details on how to configure the properties of the Sankey component.
Basics
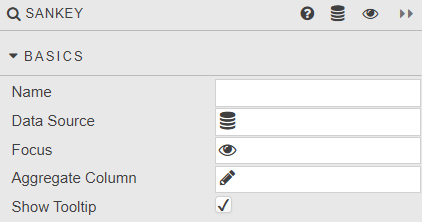
Open the Basics properties on the right and configure the properties described in the following table.
|
Field |
Description |
|---|---|
|
Name |
Enter a name for the component. |
|
Data Source |
This must be a pivot query data source. Refer to Data sources for further details. |
|
Focus |
A view state parameter for linking components. |
|
Aggregate Column |
The dependent data source variable used to create the flow map. |
|
Show Tooltip |
Toggle display of tooltip. |
Style, Margins and Format
Refer to Style for details.