Data Filter
This page describes how to set up and configure the Data Filter component..
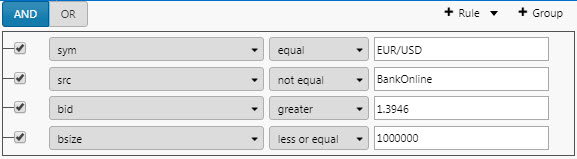
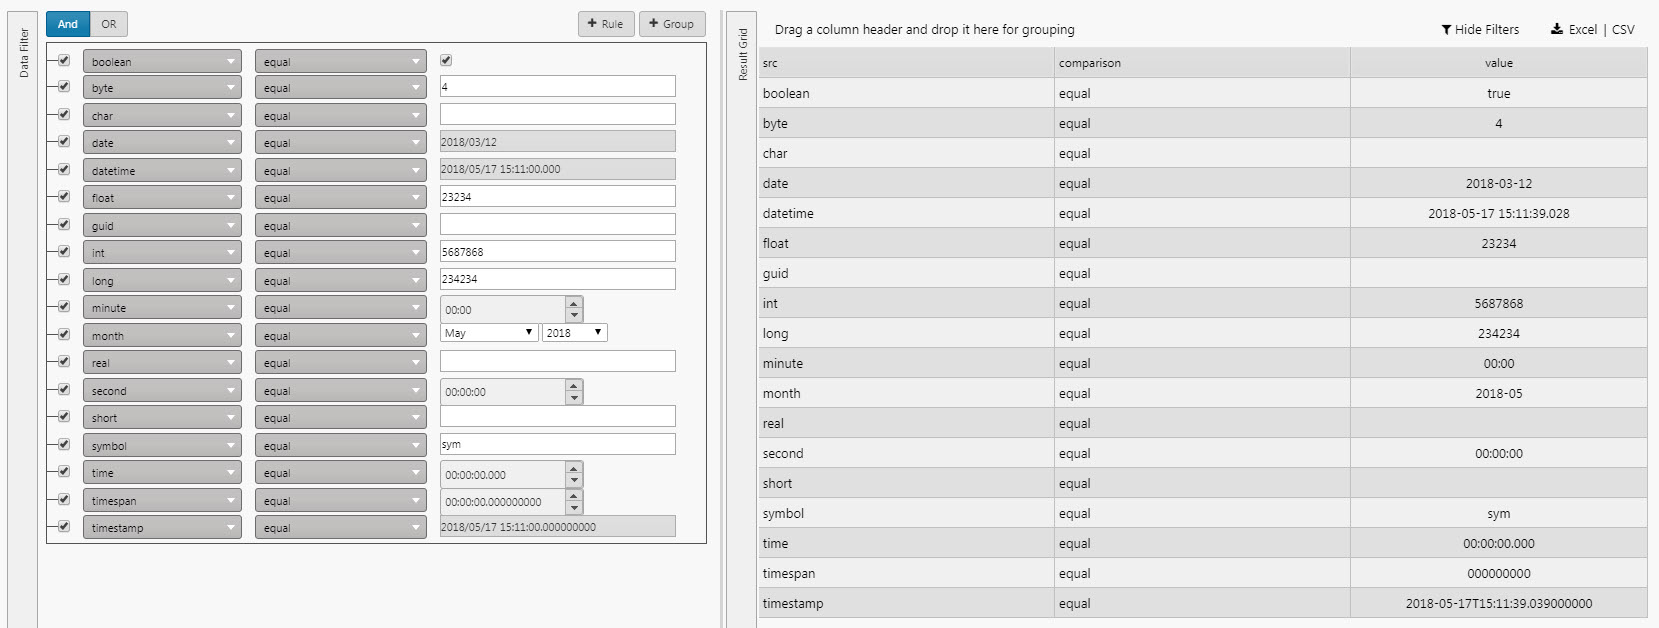
The Data Filter is a server-side filter tool to manage data in the KX Dashboards UI. The output is displayed in a component; for example a Data Grid or Canvas Chart . The following example shows a Data Filter with a nested filter event.
Set up a Data Filter
To set up a Data Filter component, click-and-drag the component into the workspace and configure the following:
-
Select the data source to filter.
-
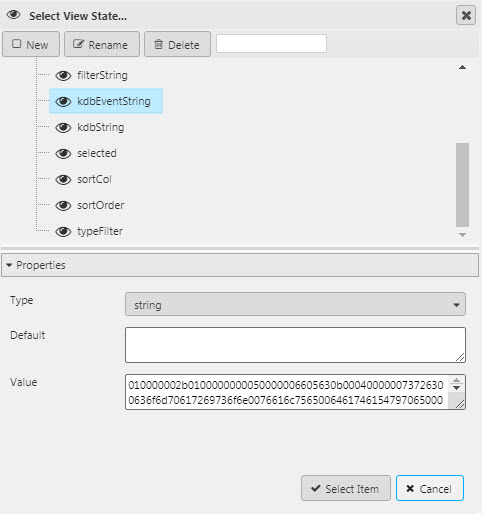
Set a view state parameter for kdb string.
Refer to Data Filter properties described in the next section for details on additional properties.
For an example, refer to build a filter.
Data Filter properties
The following sections provides details on how to configure the properties of the Data Filter component.
Basics
Open the Basics properties on the right and configure the properties described in the following table.

|
Field |
Description |
|---|---|
|
Name |
Enter a name for the component. |
|
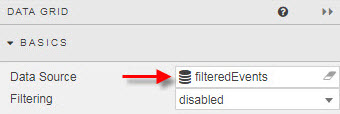
Data Source |
This is the data set on which filtering events act. Data columns from this source populate the Fields section and are available for selection in the drop-down Filter.
|
|
Query Model |
The query model is built by the filter UI. It does not need to be defined in advance. The following example filter, is represented by the query model shown below.
Query Model JSON Copy
|
|
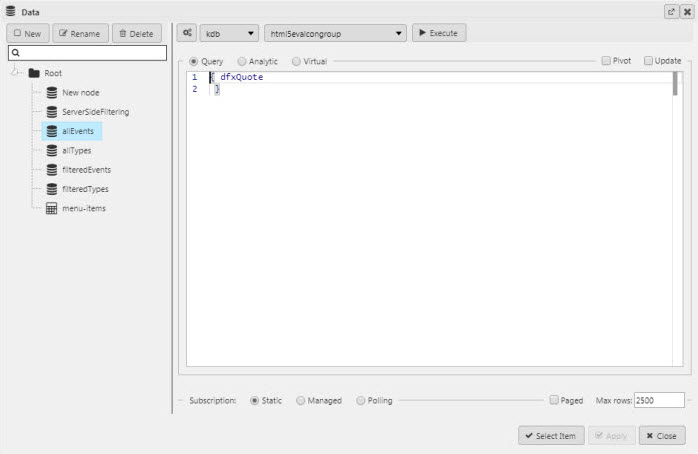
KDB String |
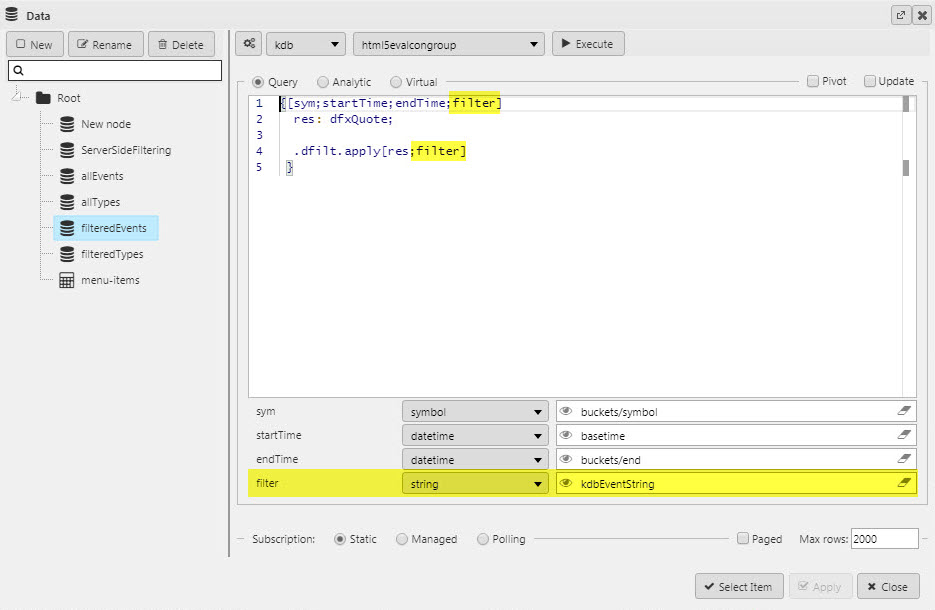
This is the output of the filter and should be assigned to a View State Parameter. The string is then parsed out using a custom Data source in another dashboard component, e.g. a Data Grid.
The KDB String is parsed with the following
q Copy
|

Bindings
Bindings allow filter nodes to be assigned to view state parameters. The Bindings available are determined by the view state type. For example, Bindings of type float are available for selection as a filter for float data.
|
Field |
Description |
|---|---|
|
Key |
The name of the assigned binding to appear in the drop-down. |
|
Viewstate |
The view state parameter used by the filter. |
Fields
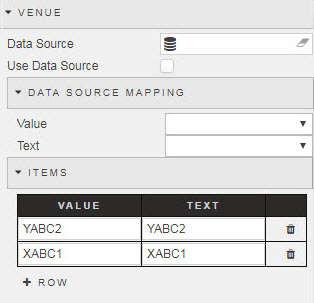
The default view is text input per the Data source column.
However, a drop-down selector can instead replace the text input. The drop-down can be created using a Data Source or by adding a row. This is done by configuring the Fields properties.
Fields Comparison

Clicking on the Compare Fields icon changes the value input field to a drop-down selector containing a list of all other columns from the data source matching the type of the currently selected column. This makes it possible to do field-to-field comparison when filtering.
Format, Style, Margins
Configure the properties, described in the following table.

|
Field |
Description |
|---|---|
|
Sort List by Selected |
When checked and the dropdown is expanded to show the items available for selection, the selected values will be displayed at the top of the list. This property only applies to the values dropdown in a field-to-value comparison. |
|
Remaining fields |
Refer to Style for common style settings. |
Build a filter
The following example shows a sample key of different Types supported by Data Filter .
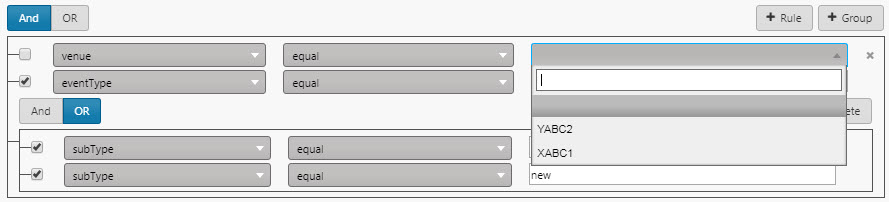
Follow these steps to build a filter.
-
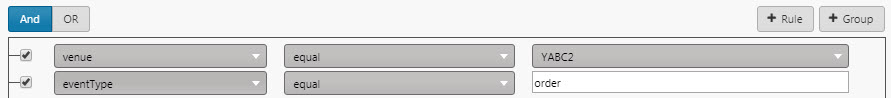
Add a rule.

The first dropdown is drawn from the data source data options.
The second dropdown is one of the operators:
equal,not equal,in,not in,like,not like,is blank,is not blank. -
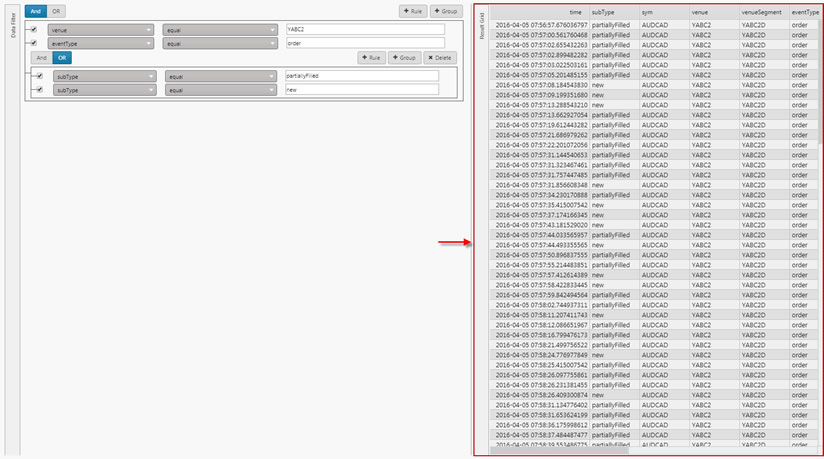
Add a second rule. In this case the AND statement requires the first and second rules to be true.
-
Add a new Group; show where
subTypeis equal torejectedORnew.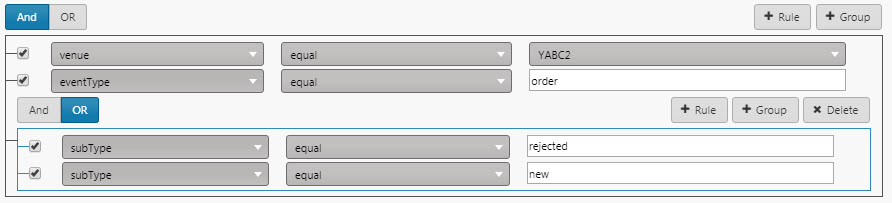
This gives a filter result in the Data Grid of:
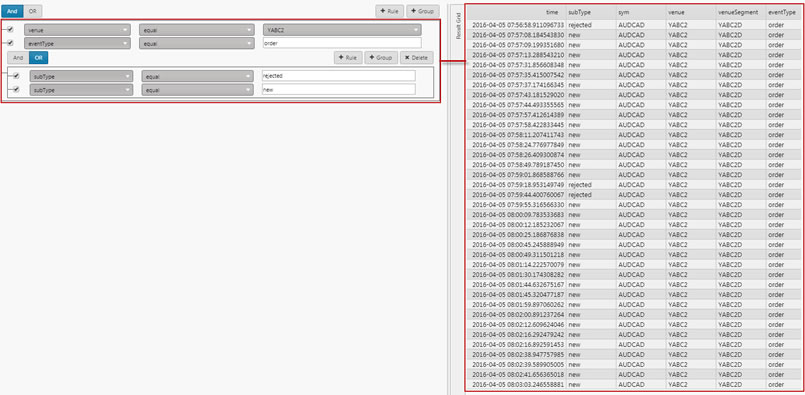
Groups, Rules, and AND/OR statements can be freely mixed and built by the user in the Dashboard.
Filter group ordering can be changed with drag-and-drop.