Playback
This page describes how to set up and configure the Playback component which replays time-series data in Data Grid and charting components
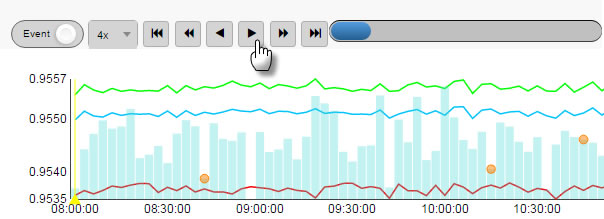
The following example shows a Bar Chart with a Playback component.
Set up Playback
To set up a Playback component, click-and-drag the component into the workspace and configure the following:
-
Set a data source with a time series component.
-
Assign a view state to Selected Value for selected time.
-
Set the Time Column from the data source.
-
Set the Interval Time to define update frequency on playback.
Refer to Playback properties described in the next section for details on additional properties.
Playback properties
The following sections provides details on how to configure the properties of the Playback component.
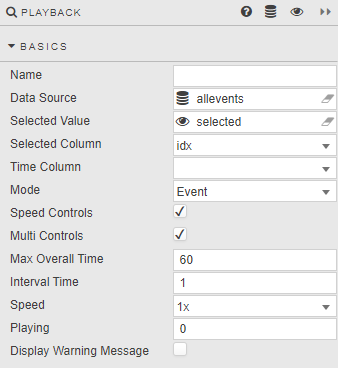
Basics
Open the Basics properties on the right and configure the properties described in the following table.
|
Field |
Description |
|---|---|
|
Name |
Enter a name for the component. |
|
Data Source |
A data source containing a time series (number, dates or timestamps), shared with the component being played back. |
|
Selected Value |
A View State Parameter for the time series. |
|
Selected Column |
An Integer or temporal column from the Data Source, used in playback sequence. |
|
Time Column |
A temporal column from the Data Source. This can be the Selected Column. |
|
Mode |
Governs the rate of replay, there are 2 modes:
|
|
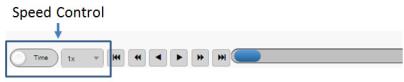
Speed Controls |
When checked, this offers a choice of replay speeds.
|
|
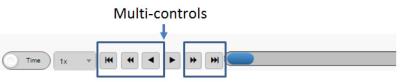
Multi Controls |
When checked, this offers fast-forward and rewind.
|
|
Max Overall Time |
Upper limit in data points (of the Time Column. For example, seconds, nanaoseconds for replay based on Selected Value View State Parameter. |
|
Interval Time |
Sampling interval of the Selected Value View State Parameter: values above |
|
Speed |
Define default speed for playback. |
|
Playing |
Define the playback.
Multiples, for example |
|
Display Warning Message |
Support messaging enabled. |
Margins, Style and Format
Refer to Style for common settings.