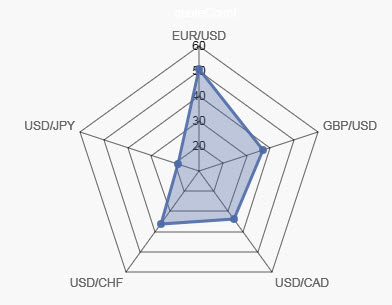
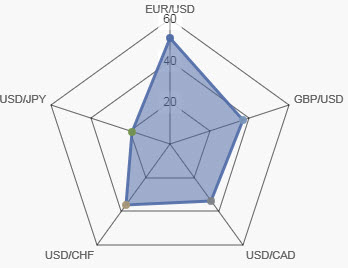
Radar Chart
This page describes how to set up and configure the Radar Chart component used to used to display multivariate data in the form of a two-dimensional chart.
Set up a Radar Chart
To set up a Radar Chart component, click-and-drag the component into the workspace and configure the following:
-
Define a data source and select chart type to create.
-
Select Radar Columns for the category data.
-
Add a Layer and define the Series Data to plot.
Refer to Radar Chart properties described in the next section for details on additional properties.
Radar Chart properties
The following sections provides details on how to configure the properties of the Radar Chart component
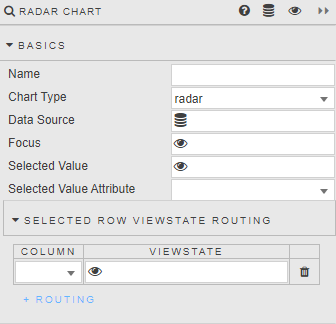
Basics
Open the Basics properties on the right and configure the properties described in the following table.
|
Field |
Description |
|---|---|
|
Name |
Enter a name for the component. |
|
Chart Type |
Dropdown selection between: |
|
Data Source |
Select a data source. |
|
Focus |
|
|
Selected Value |
Set these fields to to capture clicks on the chart.
Refer to Selected values for details. |
|
Selected Value Attribute |
|
|
Selected Row ViewState Routing |
Data
Configure the properties described in the following table.

|
Field |
Description |
|---|---|
|
Radar Columns |
Select from data source or view state parameter; values represent radar labels. |
|
GridLine color |
Use these fields to define radar color and opacity line.
Opacity is a value between 0 and 100. |
|
AngleLine color |
|
|
Gridline Opacity |
|
|
AngleLine Opacity |
Layers
Configure the properties described in the following table for each Layer. Click + Layer to add additional layers.
|
Field |
Description |
|---|---|
|
Data |
Determine which data column is charted. |
|
Color |
Use these fields to set the area and border color of the radar. |
|
Border Color |
|
|
Use color Palette |
|
|
Radar Color Opacity |
|
|
Display Name |
Enter a descriptive name of the data layer (label in chart). |
|
Point Style |
Define criteria of radar points. Select from |
|
Point Radius |
Legend
Configure the properties described in the following table.
|
Field |
Description |
|---|---|
|
Show |
Toggle display of legend. |
|
LabelColor |
Set legend font color. |
|
Position |
Place legend |
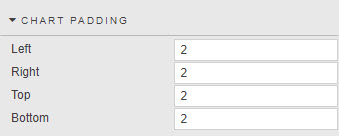
Chart padding
Configure the properties described in the following table.
|
Field |
Description |
|---|---|
|
Left |
Use these fields to assigns internal pixel padding. |
|
Right |
|
|
Top |
|
|
Bottom |
Ticks
Ticks properties control radar internal grid labels. Configure the properties described in the following table.
|
Field |
Description |
|---|---|
|
Display |
Toggle display of tick labels. |
|
Font Color |
Define the color of tick labels. |
|
Font Size |
Define the size of tick labels. |
|
Show Label Backdrop |
Adds white space around labels, improving clarity. |
|
Backdrop Color |
Set the radar tick label color padding. |
|
Backdrop Padding X and Y |
Set the radar tick label area padding. |
|
Max Ticks Limit |
This sets the number of radar zones.
|
|
Begin at Zero |
Central point of radar starts at zero versus best fit. |
|
Format |
Select from |
|
Decimal Places |
When the Format is set to |
|
Hide Trailing Zeroes |
When checked trailing zeroes in a number are not displayed. |
|
Date/Time Format |
Set date type when the selected Format is |
|
Prefix |
Apply text label as a prefix or suffix. For example, "%", "£", "$". |
|
Suffix |
|
|
Radar Labels Size |
Set font size of outer radar labels. |
Tooltip
Configure the properties described in the following table.
|
Field |
Description |
|---|---|
|
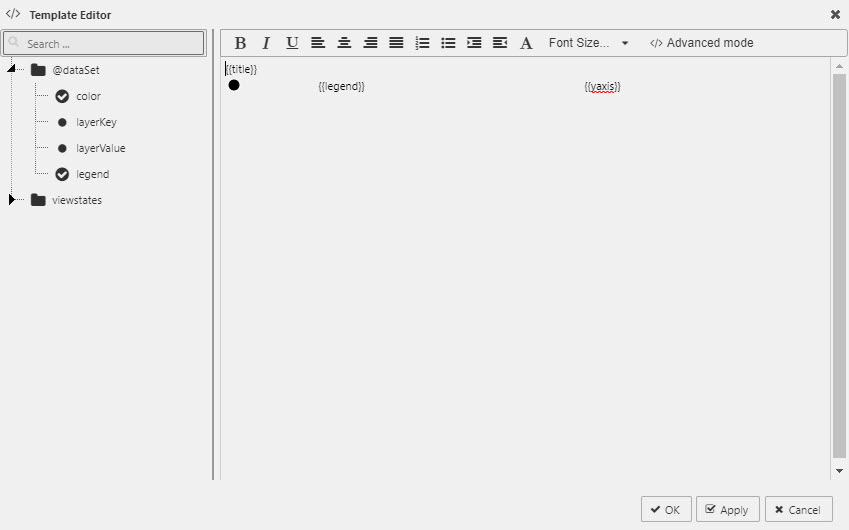
Custom Tooltip |
Refer to Custom tooltips for details. |
|
Stack Tooltip Data |
When checked, it will subtract current level from previous level to return a differential. |
Color palette
Define the color palette to be used when the radar chart uses OLAP/Pivot data.
Animations
Configure the property described in the following table.
|
Field |
Description |
|---|---|
|
Enabled |
When checked offers smoothing render animation. |
File export
Refer to Export for details.
Style, Format, Margins
Refer to Style for common settings.
Further Reading