Range Slider
This page describes how to set up and configure the Range Slider component which offers select filtering of sequential range data, for example, time or date.
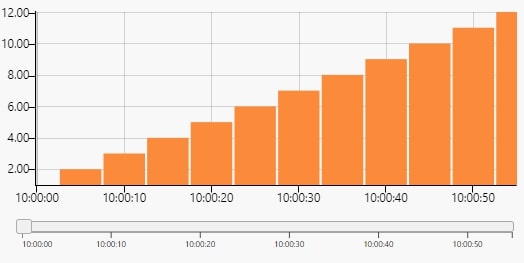
The following example shows a chart with a range slider.
Set up a Range Slider
To set up a Range Slider component, click-and-drag the component into the workspace and configure the following:
-
Set data source to include the range period you wish to use.
-
If using a single selector for the range slider then set a view state parameter to Selected Value. If using a min/max selector, then set view state parameters for each of Selected Min Value and Selected Max Value.
-
Use the Selected Min Value and Selected Max Value or Selected Value view state parameters in queries where you want the output filtered by the range slider.
Refer to Range Slider properties described in the next section for details on additional properties.
Range Slider properties
The following sections provides details on how to configure the properties of the Range Slider component.
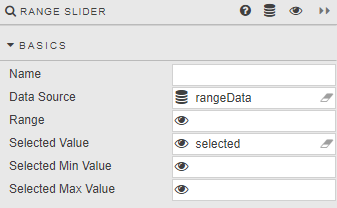
Basics
Open the Basics properties on the right and configure the properties described in the following table.
|
Field |
Description |
|---|---|
|
Name |
Enter a name for the component. |
|
Data Source |
|
|
Range |
A View State Parameter: links the Range Slider to another component, which has the same View State Parameter in its Range. |
|
Selected Value |
A View State Parameter for the value selected. |
|
Selected Min Value |
View State Parameters for the minimum/maximum value of the selected range. Refer to Selected values for further details.
|
|
Selected Max Value |
X axis
Configure the properties described in the following table.
|
Field |
Description |
|---|---|
|
Axis Value |
A Data Source column to be used as the X-axis label. |
|
Axis Type |
Data type for the Axis Value. Tip If X-axis labels look incorrect, try selecting a different type. |
|
Axis Format |
For when Axis Type is |
|
Axis Scale |
The options are:
|
|
Ticks |
When Use Fixed Num of Ticks is checked, the chart displays Num of Ticks ticks in the X axis. When Show All Ticks is checked, every charted data point is shown in the X axis . |
|
Rotation |
Rotation of X axis labels. |
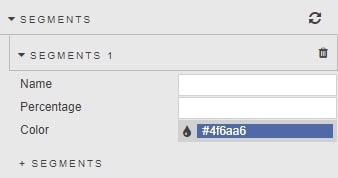
Segments
Allows for custom look of range slider by percentage zones. Configure the properties described in the following table.
|
Field |
Description |
|---|---|
|
Name |
Enter the zone name. |
|
Percentage |
Set the percentage area filled by segment zone. |
|
Color |
Define the color shading of the range slider for the defined percentage area. |
Style, Margins and Format
Refer to Style for common settings.