Stream Data from Kafka
This page provides a walkthrough on how to use kdb Insights Enterprise to stream data from Kafka to monitor NYC subway train punctuality for travel planning.
Apache Kafka is an event streaming platform that seamlessly integrates with kdb Insights Enterprise, enabling real-time data processing through pipelines connected to Kafka data sources.
We have provided a Kafka subway feed for use in this walkthrough, which generates live alerts for NYC Subway trains tracking arrival time, station location co-ordinates, direction, and route details.
Before you build your pipeline, you must ensure the insights-demo database is created, as described here.
The following sections describes how to:
-
Create a pipeline. Create the
subwaypipeline and add it to theinsights-demopackage. This pipeline contains the following nodes:Reader: The reader stores details of data to import, including any required authentication.
Decoder This decodes Kafka event data, which is in JSON, to a kdb+ friendly format (a kdb+ dictionary).
Transform: This applies a schema which converts data to a type compatible with a kdb Insights Database. Every imported data table requires a schema and every data table must have a timestamp key to be compatible with kdb's time series columnar database. The
insights-demodatabase has a predefined schema for subway data.Writer: This writes transformed data to the kdb Insights Enterprise database.
Map: This node uses enlist to convert the decoded data to a kdb+ table prior to deployment.
-
Ingest the data. To run the pipeline you have just created to ingest data into the insights-demo database.
Create a pipeline
To setup the pipeline, containing the nodes described in the previous section:
-
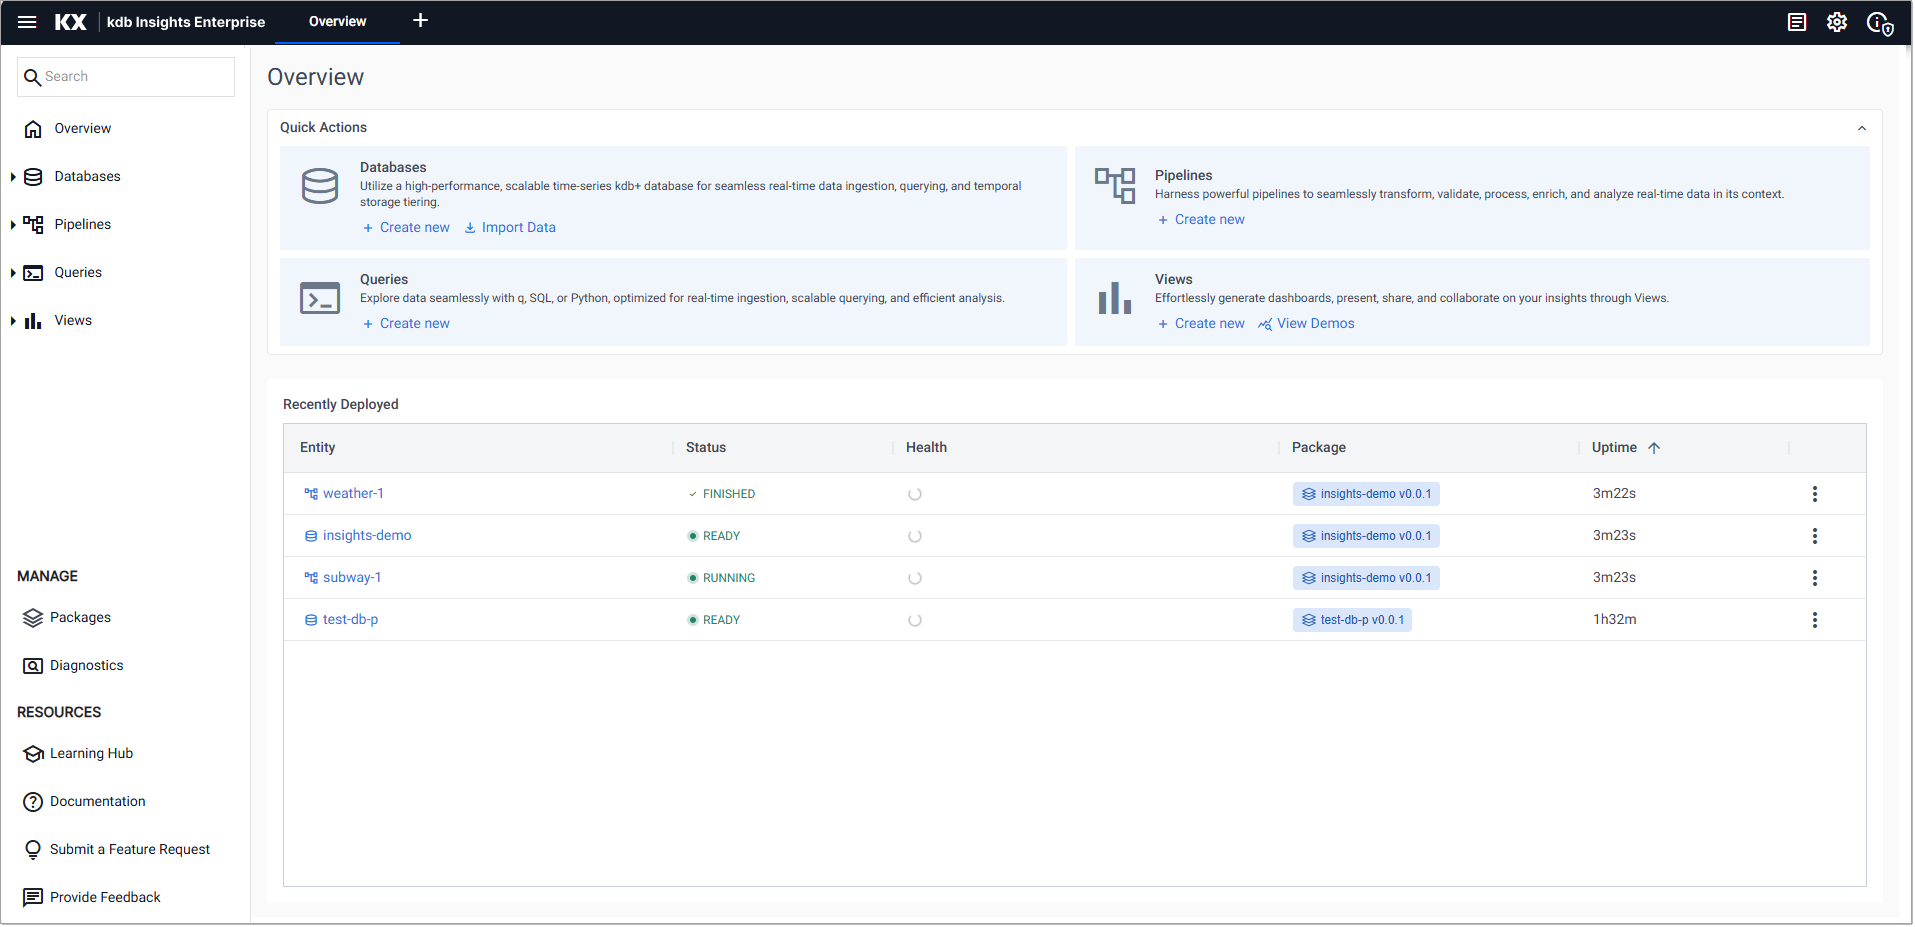
On the Overview page, choose Import Data under Databases:
-
In the Import your data screen select the Kafka reader.
-
In the Configure Kafka screen:
-
Enter values for:
Setting
Value
Broker
kafka.trykdb.kx.com:443Topic
subwayThe default values can be accepted for the following:
Setting
Value
Offset
EndUse TLS
Unchecked
Use Schema Registry
Unchecked
-
Open the Advanced drop-down and check Advanced Broker Options.
-
Click + under Add an Advanced Configuration and enter the following key value-pairs:
Key
Value
sasl.username
demo
sasl.password
demo
sasl.mechanism
SCRAM-SHA-512
security.protocol
SASL_SSL
-
Click Next.
-
-
In the Select a decoder screen click JSON.
-
In the Configure JSON screen click Next, leaving Decode each unchecked.
-
In the Configure Schema screen:
Setting
Value
Data Format
Any-
Click the Load Schema icon next to Parse Strings.
Setting
Value
Database
insights-demoTable
subway-
Click Load.
-
Click Next.
-
-
In the Configure Writer screen:
-
Select
insights-demoas the database. This is the database you created here. -
Select
subwayas the table. -
Keep the default values for the remaining fields
Setting
Value
Write Direct to HDB
UncheckedDeduplicate Stream
CheckedSet Timeout Value
Unchecked -
-
Click Open Pipeline to open a view of the pipeline.
Setting
Value
Pipeline Name
subway-1Select a Package
insights-demo -
Click Create.
-
In the pipeline template:
-
Click-and-drag a Map node, from the list of Functions, into the workspace.
-
Remove the connection between Decoder and Transform nodes by right-clicking the link and selecting Delete Edge.
-
Connect the Map node to the Decoder and Transform nodes.
-
Click on the Map node to edit its properties and set the enlist data as shown below.
q
Copy{[data]
enlist data
} -
Click Apply to apply these changes to the node.
-
-
Click Save.
Deploy the pipeline
Deploy the package containing the database and pipeline in order to ingest the data into the database.
-
Go to the Packages index and click on the three dots beside
insights-demopackage and click Deploy.Note
It may take Kubernetes several minutes to release the necessary resources to deploy the pipeline.
If the package or its database are already deployed you must tear it down. Do this on the Package index by clicking on the three dots beside insights-demo package and click Teardown.
-
Check the progress of the pipeline under the Running Pipelines panel on the Overview tab. The data is ready to query when Status =
Running.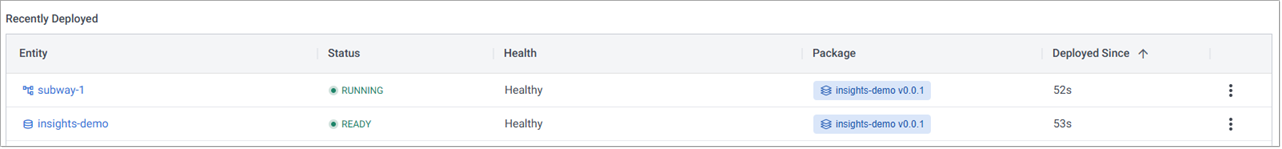
Warning
Pipeline warnings
Once the pipeline is running some warnings may be displayed in the Running Pipelines panel of the Overview tab, these are expected and can be ignored.
Next steps
Now that data has been ingested into the weather table you can:
-
Visualize the subway data from the data
Further reading
Use the following links to learn more about specific topics mentioned in this page: