View Ingested Data
This section guides you through the steps to create Views in the kdb Insights Enterprise Web Interface.
You can build rich data visualizations in kdb Insights Enterprise using over 40 components including tables, maps, charts and more.
Create a View
The following steps explain how to create a View containing a Data Grid. This Data Grid can then be customized to display data from the walkthroughs created earlier.
-
The
insights-demodatabase must be created and added to theinsights-demopackage. Refer to the create a package and database walkthrough for details. -
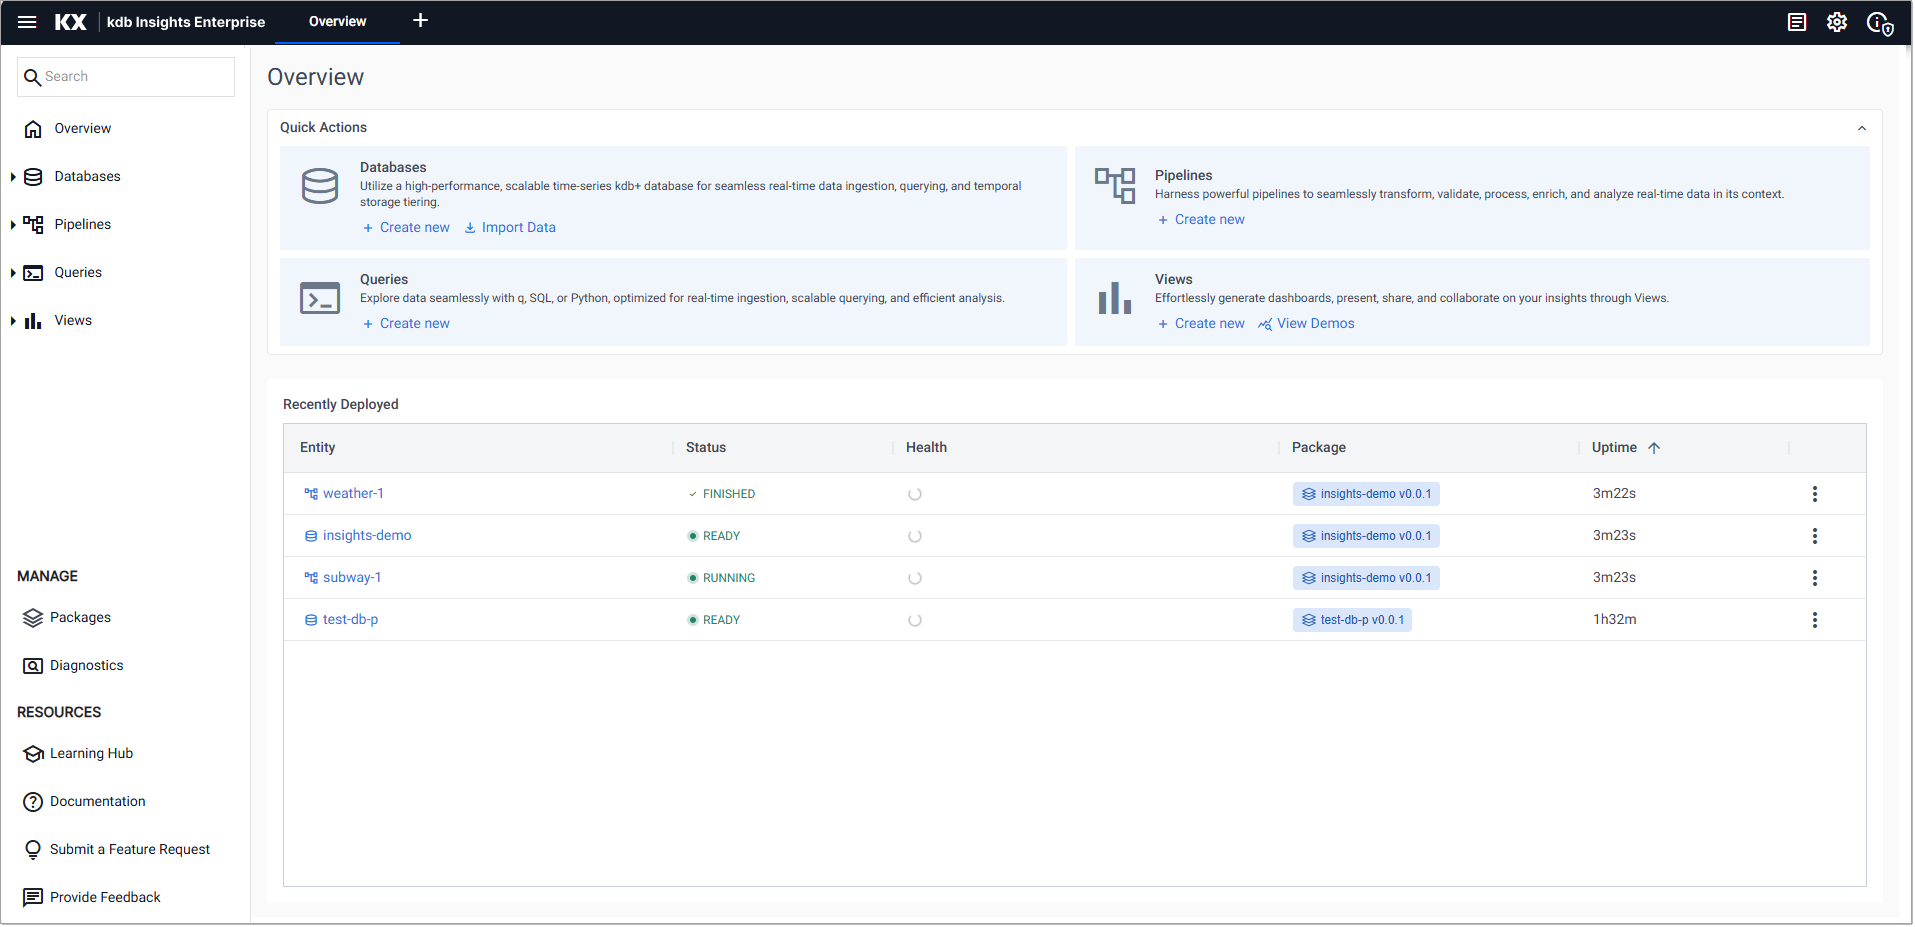
Click Create New under Views on the Overview page.
-
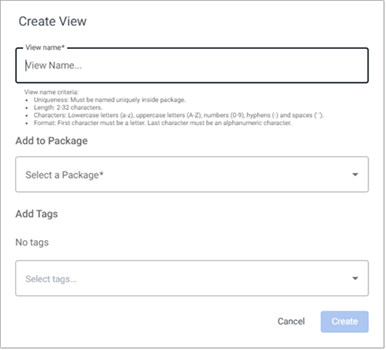
In the Create View dialog set the following values:
Setting
Value
View Name
insights-demo-viewSelect a Package
insights-demo -
Click Create.
Note that to add the new view to the
insights-demopackage the package must not be deployed. If it is you must tear it down to proceed. -
Click-and-drag a a Data Grid (first component on the list), from the component menu into the central workspace.
-
With the component selected, Click to populate Data Source.
or click Data Source in the Basics properties for the selected component.
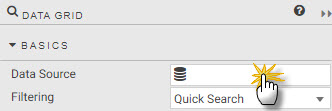
Information
When a component is selected in the workspace it displays a light-blue border. -
Click New to add a new Data Source.
-
Enter a name for the Data Source.
-
Click API to configure the Data Source. This walkthrough uses API to setup the Data Source. For further information on the other Data Sources see here.
-
Select the relevant tab in the next section to customize the Data Source for weather, crime, subway or health data sets.
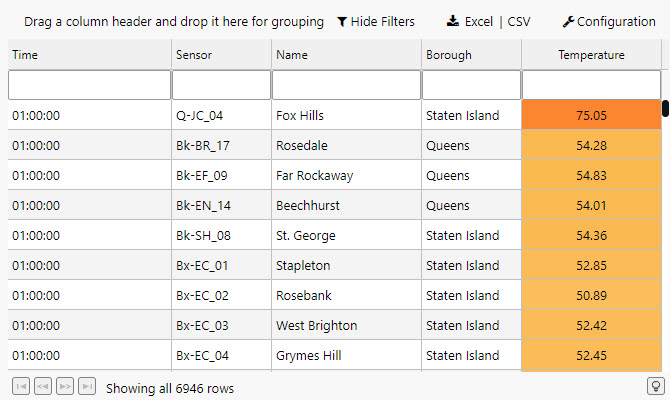
Data Grid
A Data Grid tabulates data and offers a range of formatting options for tables, including highlight rules and custom templates.
Once you have completed the step in the previous section to create your view with the data grid, select the tab below that corresponds to the data set you have already ingested. Then complete the configuration to create a data grid for that tables data.
weather
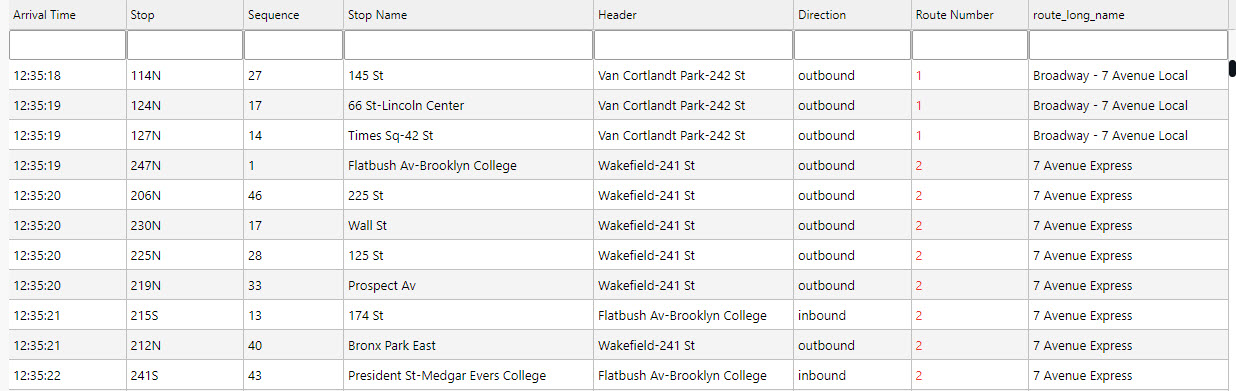
subway
health
crime
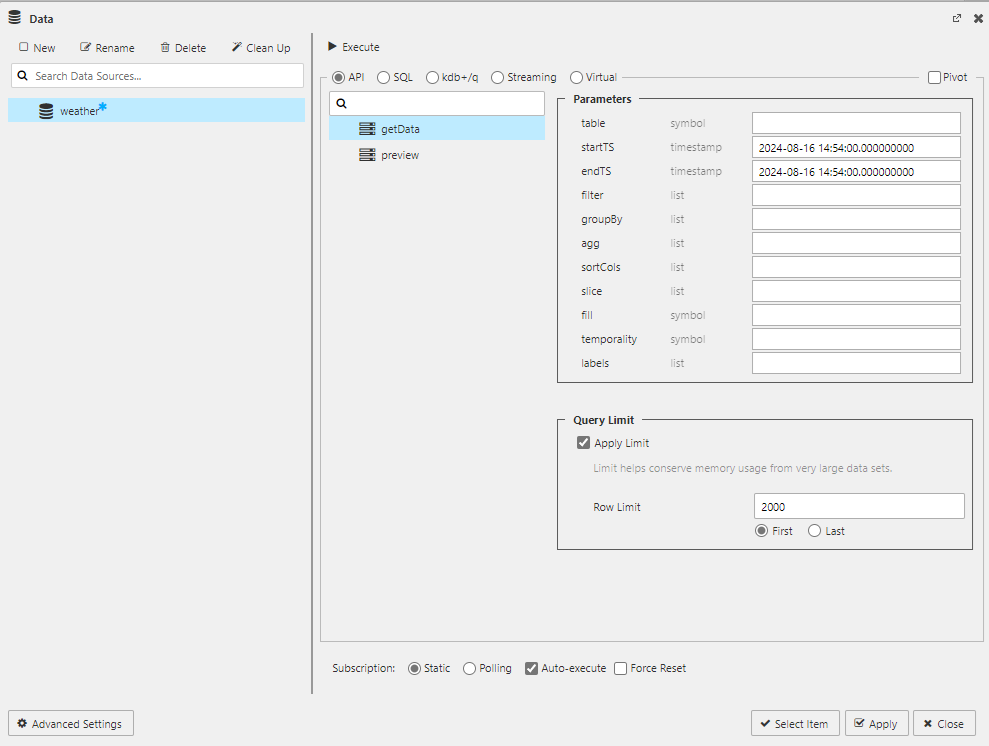
Name the new Data Source weather and configure the following API properties.
|
Property |
Value |
|---|---|
|
table |
|
|
startTS |
2022-07-28T00:00:00.000000000
|
|
endTS |
2022-07-28T23:59:00.000000000
|
Click Execute, Apply and then Select Item to apply the data to the Data Grid. This step closes the query editor.
Note
Defining table in the query editor
When creating a new data source, the table is the name of the data table as hosted on the database, it's not the Output variable as defined when exploring the data.
Basics
In the Basics properties enable Custom Layout for end-user control of the columns to be displayed.
|
Property |
Value |
|---|---|
|
Filtering |
Column Filters |
Custom Filters
In the Custom Filters properties you can add a greater level of filter control with the following custom filters:
|
Property |
Value |
|---|---|
|
timestamp |
|
|
sensor |
|
|
airtemp |
|
|
name |
|
|
borough |
|
Columns
Use the Column properties to apply column configurations which style content and widths for the display of data in the table.
|
Column |
Display Name |
Min Width |
Text Align |
Format |
Precision |
Date Format |
Time Format |
Range Color |
Template |
Hidden |
|---|---|---|---|---|---|---|---|---|---|---|
|
timestamp |
Time |
|
Left |
Time |
- |
- |
|
- |
- |
- |
|
sensor |
Sensor |
|
Left |
General |
- |
- |
- |
- |
- |
- |
|
airtemp |
Temperature |
|
Center |
Formatted Number |
2 |
- |
- |
- |
- |
- |
|
name |
Name |
|
Left |
General |
- |
- |
- |
- |
- |
- |
|
borough |
Borough |
|
Left |
General |
- |
- |
- |
- |
- |
- |
|
longitude |
longitude |
- |
- |
- |
- |
- |
- |
- |
- |
Yes |
|
latitude |
latitude |
- |
- |
- |
- |
- |
- |
- |
- |
Yes |
|
color |
color |
- |
- |
- |
- |
- |
- |
- |
- |
Yes |
You can re-arrange the column order with a click-and-drag to move columns. For example, select the Temperature column and reposition it below the Borough Column in the Data Grid Columns properties.
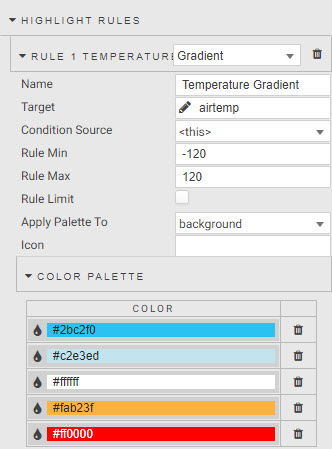
Highlight Rules
Set Highlight Rules properties to create a color gradient for temperature. Use a Gradient highlight rule to give temperature definition in the table, using the following properties.
|
Property |
Value |
|---|---|
|
Name |
|
|
Target |
|
|
Rule Min |
|
|
Rule Max |
|
|
Apply Palette To |
|
|
COLOR PALETTE |
|
Selection & Routing
The Selection & Routing properties are used to pull value(s) from a table and set them to a view state parameter. A view state parameter is a stored value accessible to all components and queries.
Change Selection Mode to Single Row to enable the selection control. Actions are used to map cell values from columns to view state parameters, enabled by a click inside the data grid. Set the Trigger Column to use wildcard, *.
Create actions to map:
|
Source column |
View state parameter |
Type |
Default |
Value |
|---|---|---|---|---|
|
sensor |
sensor |
symbol |
Q-JC_04
|
Q-JC_04
|
|
borough |
borough |
symbol |
- |
- |
|
name |
name |
symbol |
- |
- |
Name the new Data Source subway and configure the following API properties.
|
Property |
Value |
|---|---|
|
table |
|
|
startTS |
|
|
endTS |
|
Note
startTS and endTS
Set startTS as 00:00 and endTS as 23:59 of the deployment date; use a SQL query to find the deployment date. Ensure both the subway pipeline and insights-demo database are running and active to access data in your View.
-
Click Execute.
-
Click Apply.
-
Click Select Item to apply the data to the Data Grid. This step closes the query editor.
Basics
Subway is an informational data set it is recommended to use a simpler Data Grid, so the following properties are recommended:
|
Property |
Value |
|---|---|
|
Filtering |
Column Filters |
|
Enable Grouping |
Unchecked |
Custom Filters
Custom Filters properties help find additional information for given routes. Columns with no custom filter use default text search. Add the following:
|
Name |
Type |
|---|---|
|
route_short_name |
Selection |
|
trip_headsign |
Selection |
|
route_long_name |
Selection |
|
direction_id |
Selection |
|
arrival_time |
DateTime |
Columns
Add the following Column configurations style content and widths for the display of data in the table under the Columns properties.
|
Column |
Display Name |
Min Width |
Text Align |
Format |
Precision |
Date Format |
Time Format |
Range Color |
Template |
Hidden |
|---|---|---|---|---|---|---|---|---|---|---|
|
trip_id |
Trip |
- |
- |
- |
- |
- |
- |
- |
- |
Yes |
|
arrival_time |
Arrival Time |
100 |
Left |
Time |
- |
- |
|
- |
- |
- |
|
stop_id |
Stop |
100 |
Left |
General |
- |
- |
- |
- |
- |
- |
|
stop_sequence |
Sequence |
100 |
Left |
General |
- |
- |
- |
- |
- |
- |
|
stop_name |
Stop Name |
250 |
Left |
General |
- |
- |
- |
- |
- |
- |
|
stop_lat |
Stop longitude |
- |
- |
- |
- |
- |
- |
- |
- |
Yes |
|
stop_lon |
Stop latitude |
- |
- |
- |
- |
- |
- |
- |
- |
Yes |
|
route_id |
Route ID |
- |
- |
- |
- |
- |
- |
- |
- |
Yes |
|
trip_headsign |
Route Header |
200 |
General |
- |
- |
- |
- |
- |
- |
|
|
direction_id |
Direction |
100 |
- |
General |
- |
- |
- |
- |
- |
- |
|
route_short_name |
Route Number |
100 |
- |
Number |
- |
- |
- |
- |
see below |
- |
|
route_long_name |
Route Name |
200 |
- |
General |
- |
- |
- |
- |
- |
- |
|
route_desc |
Description |
- |
- |
- |
- |
- |
- |
- |
- |
Yes |
|
route_type |
Type |
- |
- |
- |
- |
- |
- |
- |
- |
Yes |
|
route_url |
Route URL link |
- |
- |
- |
- |
- |
- |
- |
- |
Yes |
|
route_color |
Route color |
- |
- |
- |
- |
- |
- |
- |
- |
Yes |
A feature of columns is custom Template.
-
Template adds custom styling to the data grid, but requires a little coding to get the most out of it.
-
Template uses Handlebars to apply column formats.
-
For subway, use the route_color column to apply color to the text of the route_short_name column; add to the Advanced mode of Template:
JavaScript
<font color="{{route_color}}">{{route_short_name}}</font>
File Export
In the File Export properties uncheck Show Export CSV button and Show Export Excel Button to hide unnecessary file export.
Name the new Data Source health and configure the following API properties.
|
Property |
Value |
|---|---|
|
table |
health |
|
startTS |
yyyy-mm-dd 00:00:00.000000000 |
|
endTS |
yyyy-mm-dd 23:59:00.000000000 |
Note
startTS and endTS
Set startTS as 00:00 and endTS as 23:59 of the deployment date; use a SQL query to find the deployment date. Ensure both the health pipeline and insights-demo database are running and active to access data in your View.
Click Execute, then click Apply. Next, click Select Item to apply the data to the Data Grid. This closes the query editor.
Basics
In the Basics properties enable Column Filtering.
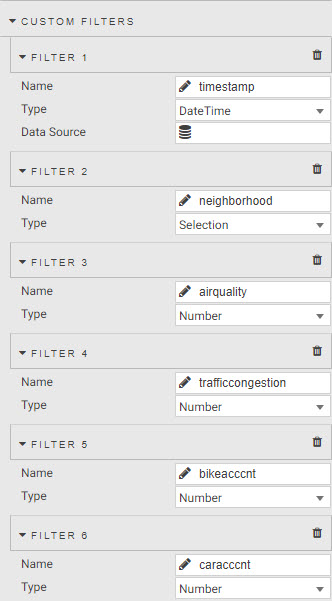
Custom Filters
Numeric columns filter with >, < or > < for a range.
|
Name |
Type |
|---|---|
|
timestamp |
DateTime |
|
name |
Selection |
|
airquality |
Number |
|
trafficcongestion |
Number |
|
bikeacccnt |
Number |
|
caracccnt |
Number |
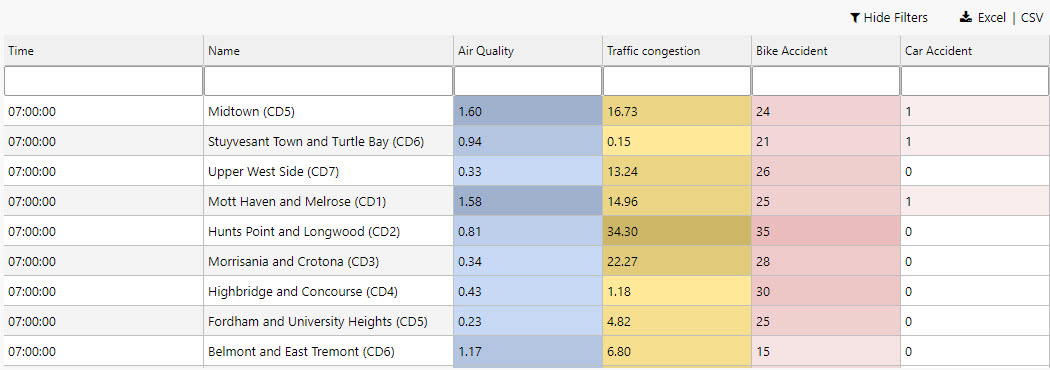
Columns
Column configurations style content and widths for the display of data in the table.
-
Use Range Color to add color gradients to numeric columns.
-
Check Invert Range Color to give high values a darker shade.
|
Column |
Display Name |
Min Width |
Text Align |
Format |
Precision |
Date Format |
Time Format |
Range Color |
Template |
Hidden |
|---|---|---|---|---|---|---|---|---|---|---|
|
name |
Name |
250 |
Left |
General |
- |
- |
- |
- |
- |
- |
|
lat |
Latitude |
- |
- |
Number |
- |
- |
- |
- |
- |
Yes |
|
long |
Longitude |
- |
- |
Number |
- |
- |
- |
- |
- |
Yes |
|
neighborhood |
Neighborhood |
250 |
Left |
General |
- |
- |
- |
- |
- |
Yes |
|
airquality |
Air Quality |
250 |
Left |
Number |
2 |
- |
- |
#d1e3ff |
- |
- |
|
trafficcongestion |
Traffic Congestion |
100 |
Left |
Number |
2 |
- |
- |
#ffe999 |
- |
- |
|
bikeacccnt |
Bike Accidents |
100 |
Left |
Number |
0 |
- |
- |
- |
- |
- |
|
caracccnt |
Car Accidents |
100 |
Left |
Number |
0 |
- |
- |
- |
- |
- |
|
timestamp |
Time |
100 |
Left |
Time |
- |
- |
|
- |
- |
- |
Change the column order to re-position the Timestamp column as the first column.
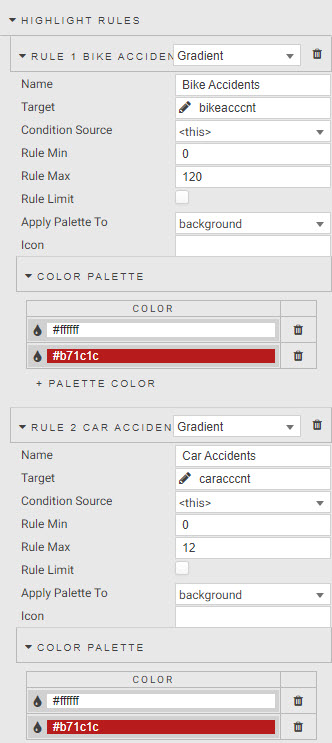
Highlight Rules
Under the Highlight Rules properties, add a color highlight for number of bike and car accidents.
|
Value |
Bikeacccnt |
Caracccnt |
|---|---|---|
|
Name |
Bike Accidents |
Car Accidents |
|
Target |
bikeacccnt |
caracccnt |
|
Rule Min |
0 |
0 |
|
Rule Max |
120 |
12 |
|
Apply Palette To |
background |
background |
|
COLOR PALETTE |
#ffffff, #b71c1c |
#ffffff, #b71c1c |
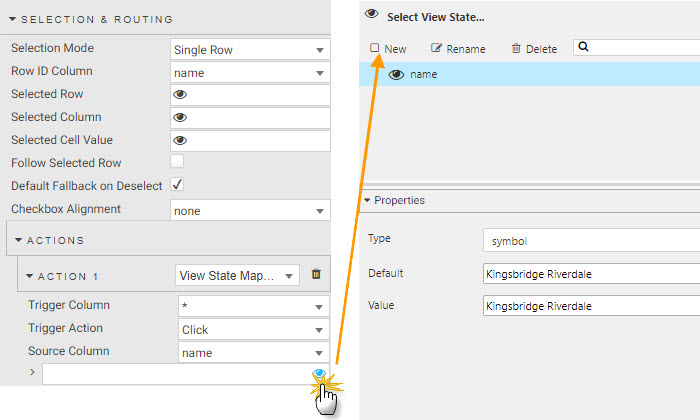
Selection & Routing
Selection & Routing properties are used to pull value(s) from a table and set it to a view state parameter. A view state parameter is a stored value accessible to all components and queries. Create a view state for neighborhood to use in other (optional) queries, for example a chart of accidents, congestion and air quality.
-
Change the Selection Mode to a Single Row.
-
Define an action to map the neighborhood name to a view state parameter. This action occurs on a click inside the Data Grid; set the Trigger Column to use the wildcard,
*.
ACTIONS
|
Property |
Value |
|---|---|
|
Trigger Column |
* |
|
Trigger Action |
Click |
|
Source Column |
name |
|
> |
view state parameter: |
Name the new Data Source crime and configure the following API properties.
|
Property |
Value |
|---|---|
|
table |
crime |
|
startTS |
2022-03-31 00:00:00.000000000 |
|
endTS |
2022-03-31 23:59:00.000000000 |
Click Execute, then click Apply. Next, click Select Item to apply the data to the Data Grid. This closes the query editor.
Note
Requires an active database and running pipeline
To build a view, the crime must be running and the insights-demo is active.
Basics
Set the following Basics properties:
|
Property |
Value |
|---|---|
|
Filtering |
Column Filters |
|
Enable Grouping |
Checked |
|
Custom Layout |
Checked |
Custom Filters
In the Custom Filter properties, use filters of Type = Selection for descriptive columns and Type = DateTime for timestamps. Set the following filters:
|
Filter |
Setting |
|---|---|
|
incident_time |
DateTime |
|
nypd_precinct |
Selection |
|
borough |
Selection |
|
patrol_borough |
Selection |
|
radio_code |
Selection |
|
crime_in_progress |
Selection |
|
call_timestamp |
DateTime |
|
displatch_timestamp |
DateTime |
|
arrival_timestamp |
DateTime |
|
closing_timestamp |
DateTime |
Columns
Set Column properties to ensure descriptive columns have sufficient width to display their information.
|
Column |
Display Name |
Min Width |
Text Align |
Format |
Precision |
Date Format |
Time Format |
Range Color |
Template |
Hidden |
|---|---|---|---|---|---|---|---|---|---|---|
|
event_id |
Event |
80 |
Left |
General |
- |
- |
- |
- |
- |
- |
|
incident_time |
Time of Incident |
100 |
Left |
Time |
- |
- |
HH:mm:ss
|
- |
- |
- |
|
nypd_precinct |
Precinct |
60 |
Left |
Number |
0 |
- |
- |
- |
- |
- |
|
borough |
Borough |
100 |
Left |
General |
- |
- |
- |
- |
- |
- |
|
patrol_borough |
Patrol Borough |
200 |
Left |
Number |
- |
- |
- |
- |
- |
- |
|
call_x_geo |
Call x-cord. |
- |
- |
Number |
- |
- |
- |
- |
Yes |
|
|
call_y_geo |
Call y-cord. |
- |
- |
Number |
- |
- |
- |
- |
- |
Yes |
|
radio_code |
Radio Code |
80 |
Left |
Number |
- |
- |
- |
- |
- |
- |
|
description |
Crime Description |
300 |
Left |
General |
- |
- |
- |
- |
- |
- |
|
crime_in_progress |
Crime in Progress? |
100 |
Left |
General |
- |
- |
- |
- |
- |
|
|
call_timestamp |
Call Time |
100 |
Left |
Time |
- |
- |
|
- |
- |
- |
|
dispatch_timestamp |
Displatch Time |
100 |
Left |
Time |
- |
- |
|
- |
- |
- |
|
arrival_timestamp |
Arrival Time |
100 |
Left |
Time |
- |
- |
|
- |
- |
- |
|
closing_timestamp |
Close Time |
100 |
Left |
Time |
- |
- |
|
- |
- |
- |
|
latitude |
Latitude |
- |
- |
Number |
- |
- |
- |
- |
- |
Yes |
|
longitude |
Longitude |
- |
- |
Number |
- |
- |
- |
- |
- |
Yes |
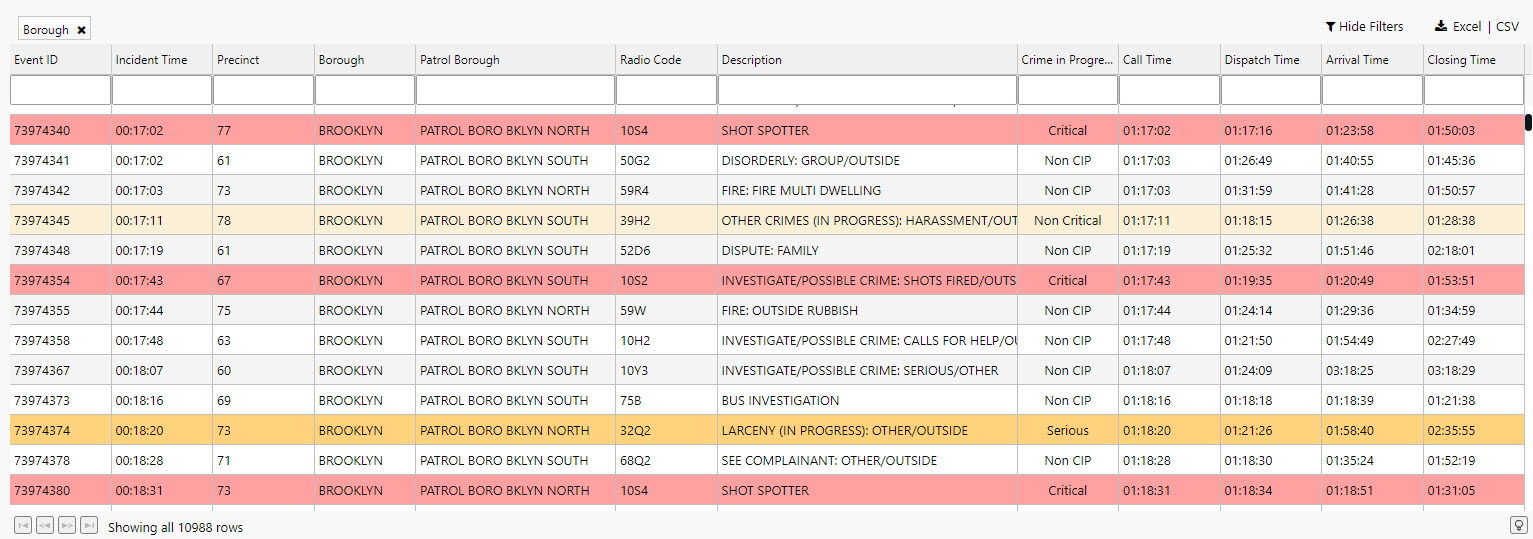
Highlight Rules
Add color highlights to give context to the seriousness of reported crime. Use wildcard, * to apply a highlight to the entire row.
|
Value |
Critical |
Serious |
Non-critical |
|---|---|---|---|
|
Name |
Critical |
Serious |
Non Critical |
|
Target |
* |
* |
* |
|
Condition Source |
crime_in_progress |
crime_in_progress |
crime_in_progress |
|
Condition Operator |
== |
== |
== |
|
Condition Value |
Critical |
Serious |
Non Critical |
|
Background Color |
#ffa1a1 |
#ffd27d |
#fcefd6 |
To learn more about highlight rules click here
Data Form with View State
This section guides you on how to create custom queries with the Data Form. A Data Form exposes view state parameters to change in the View; for example, startTS and endTS parameters.
-
Click-and-drag a Data Form into the View.
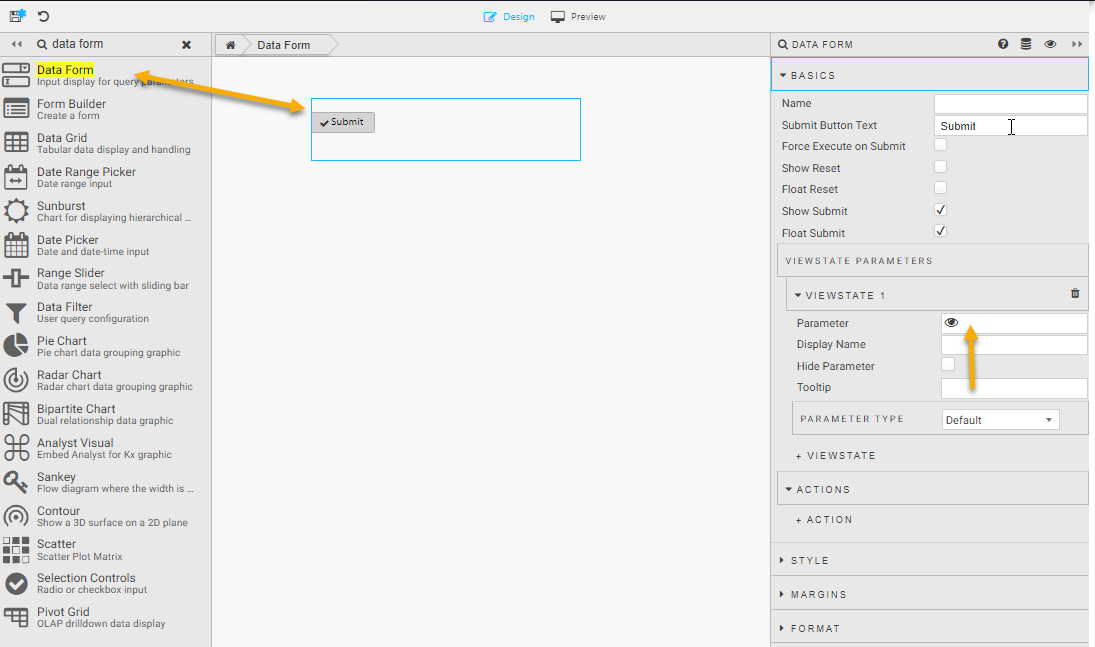
-
Click on the Parameter property under Viewstate Parameters to open the view state parameter dialog.
-
To create view states for startTS and endTS:
-
Click New to create view states for Start Time and End Time with the following properties:
Property
Value
Type
Set both to
timestamp.Default
Use the deployment date as the default value for bothstartTS and endTS. Use a SQL query to find the deployment date for
weather,subwayorhealthdata sets. These values are shown in the tabs below.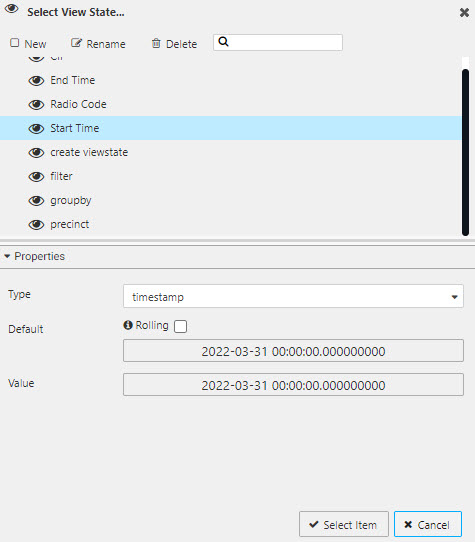
-
Start Time
weather, subway and health
crime
|
Property |
Value |
|---|---|
|
Type |
|
|
Default |
|
|
Value |
|
Note
Use the deployment date for Default and Value yyyy-mm-dd.
|
Property |
Value |
|---|---|
|
Type |
|
|
Default |
|
|
Value |
|
End Time
weather, subway and health
crime
|
Property |
Value |
|---|---|
|
Type |
|
|
Default |
|
|
Value |
|
Note
Use the deployment date for Default and Value yyyy-mm-dd.
|
Property |
Value |
|---|---|
|
Type |
|
|
Default |
|
|
Value |
|
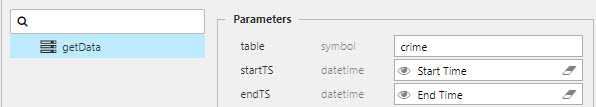
Use View State Parameters in Data Source
To use the View State parameters, created above:
-
Replace the startTS and endTS values, set in the Data Grid, with their corresponding View State parameters in the data editor as shown below.
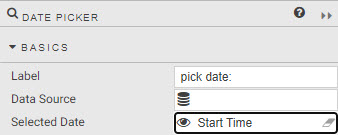
Note
Date picker
Date icker is a time-specific input; map Start Time or End Time view states to the Selected Date property under the list of Basics options.
Filter
Use the Filter property of the data editor.
-
Create a view state of type List (named
filter) and assign to the Filter property of data editor in Data Grid.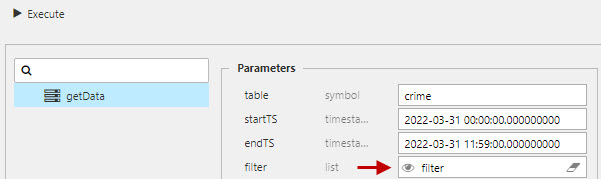
-
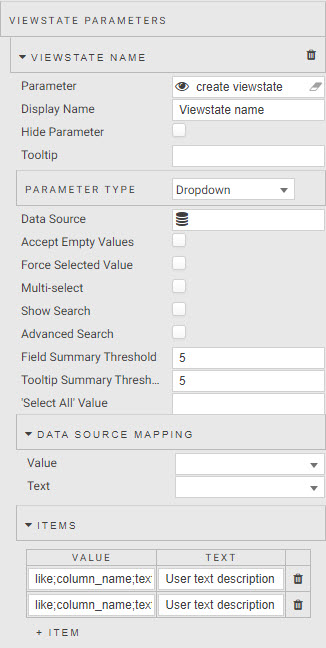
Add a Data Form.
-
Map the created
filterview state to ViewstateParameterof the Data Form. -
Switch Parameter Type to
Dropdown -
Add Items corresponding to the selected values.
There is a special case for defining the Value for Items which uses the following structure as determined by the getData API.
q
=;column_name;value
|
item |
setting |
|---|---|
|
|
matches numeric values, use |
|
|
data column name referenced in the database. |
|
|
filter value; numeric for |
Filter values by data set:
subway
crime
health
|
Property |
Value |
|---|---|
|
Parameter |
Direction view state parameter |
|
Display Name |
Direction |
Set the following Items:
|
Item |
Value |
|---|---|
|
|
Inbound |
|
|
Outbound |
|
Property |
Value |
|---|---|
|
Parameter |
|
|
Display Name |
Crime In Progress |
Set the following Items:
|
Items |
Value |
|---|---|
|
|
Critical |
|
|
Not in Progress |
|
|
Not Critical |
|
|
Serious |
|
Property |
Value |
|---|---|
|
Parameter |
Car Accident view state parameter |
|
Display Name |
Number of Car Accidents |
Set the following Items:
|
Item |
Value |
|---|---|
|
|
None |
|
|
One |
|
|
Two |
|
|
Three |
|
|
Four |
|
|
Five |
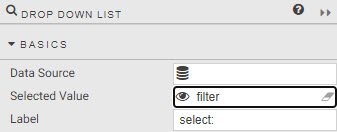
Note
Drop Down List is a self-contained dropdown component. Assign the filter view state parameter to Selected Value property listed under Basics. Define Items as for data form.
Next steps
Further reading
Click a link below to learn more about the following: