Diagnostics
This page describes how to troubleshoot database, pipeline and system errors with Diagnostics, accessed through the kdb Insights Enterprise Web Interface.
Diagnostics help you to monitor system health, diagnose issues, and maintaining optimal performance of kdb Insights Enterprise deployments.
Access Diagnostics
There are a few ways to access diagnostics information.
-
Click Diagnostics, under MANAGE, in the left-hand-side bar to open the Diagnostics screen.
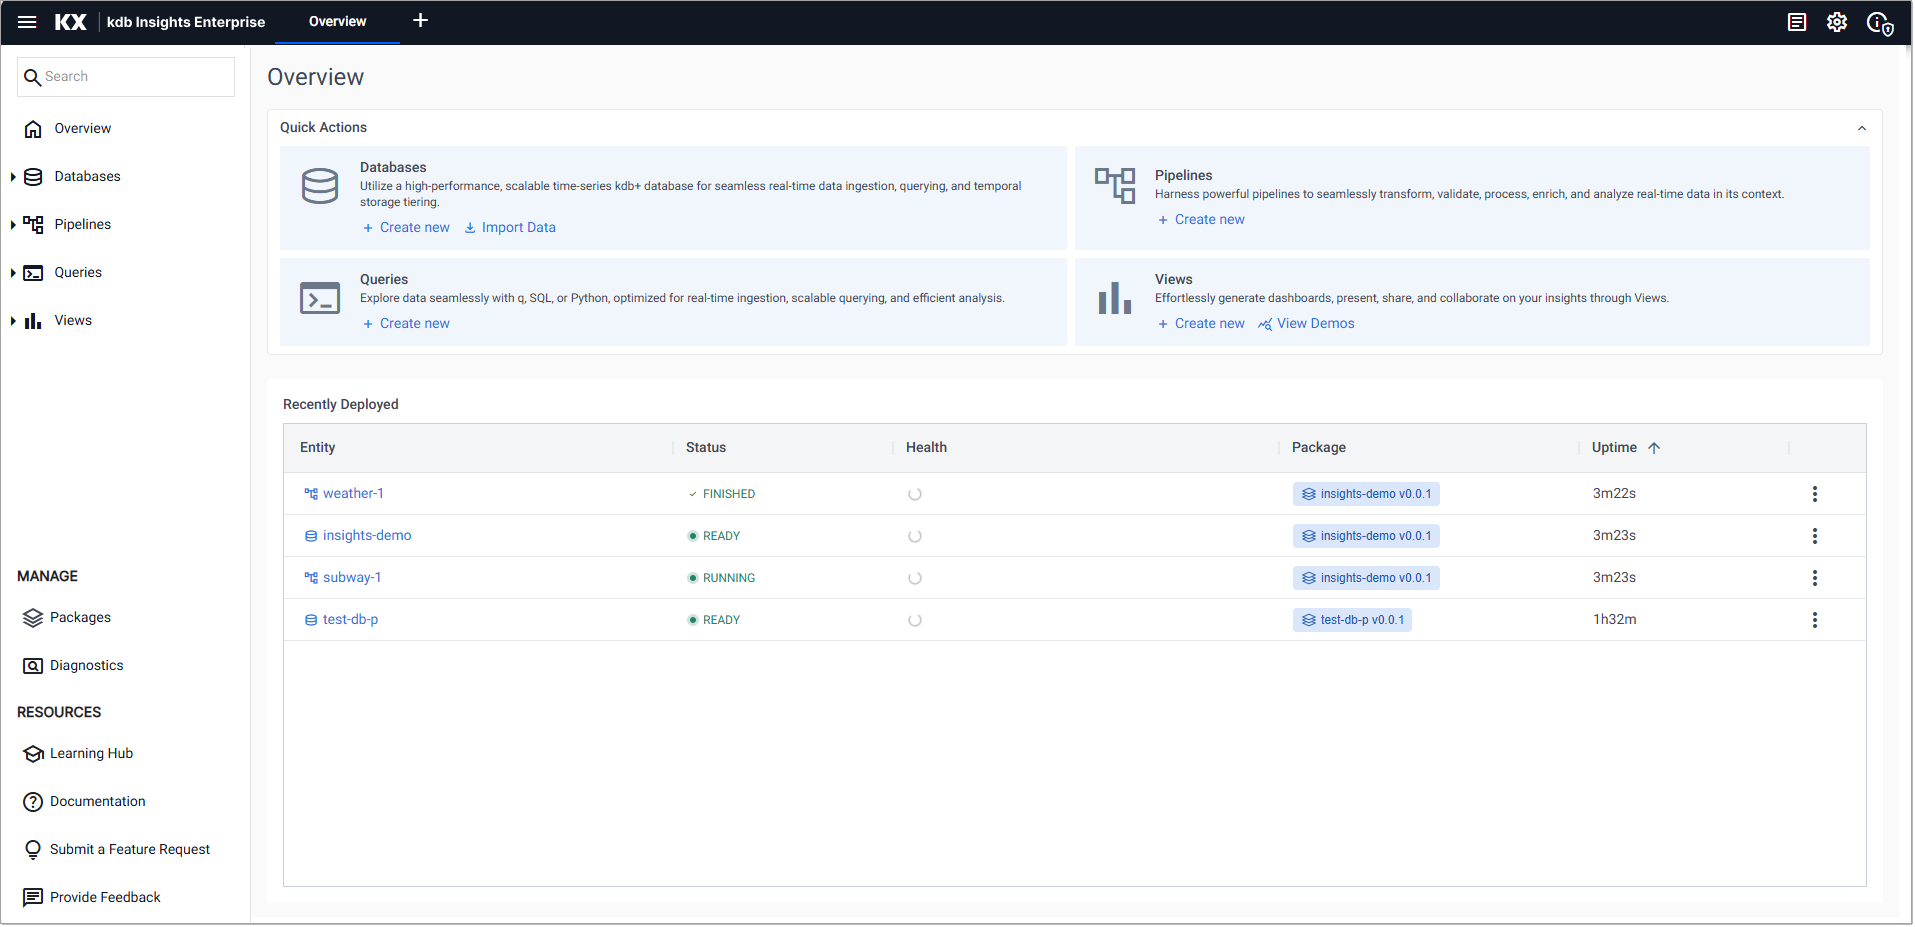
Important
Permissions
Ensure you have the appropriate Keycloak role permissions, otherwise the Diagnostics option is not displayed.
This screen has a search box and 2 dropdowns. Use these to select a database or pipeline that you want to troubleshoot.
Expand either the Databases or Pipelines dropdowns and select a database or pipeline. Alternatively, type the name in the search box. This opens the diagnostics for that entity.
-
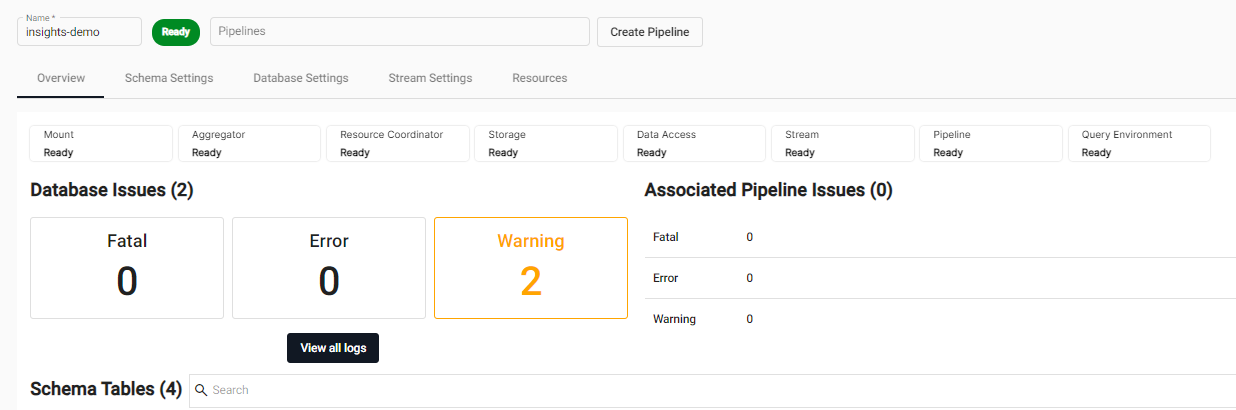
You can access Database diagnostics from the Overview tab of the Database screen. The you can do one of the following:
-
Click the button corresponding to the reported event (
Fatal,Error,Warning) -
Click View all Logs
-
-
You can access Pipeline diagnostics by clicking the View Diagnostics icon for a selected Pipeline in the Running Pipelines of the Overview page.
From the Diagnostics screen, you can now view Application Logs and/or Diagnostic Events for the selected Database or Pipeline.
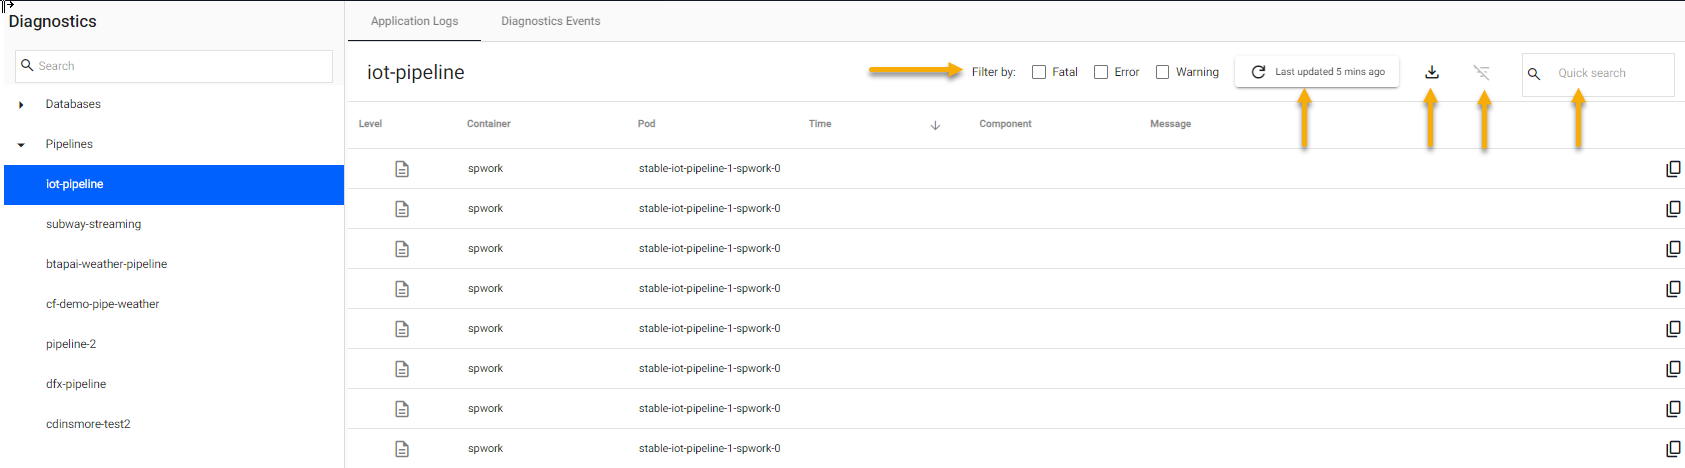
Application Logs
The Application Logs tab displays logs generated by a database or pipeline deployment. Results are paged and can be exported, refreshed, searched, and sorted.
-
The logs can be filtered by ticking one of the event options:
-
Fatal -
Error -
Warnings
-
-
When you access these logs from the Database screen, by clicking the event icon, the logs are filtered based on the event selected.
-
Reset the filters by clicking the Reset Column Filters icon.
-
The time since last update is displayed next to the refresh icon for both events and logs.
-
Download a '.json' report of events or logs by clicking the Download Table icon.
-
Refine your results based on a value entered in the Quick Search box.
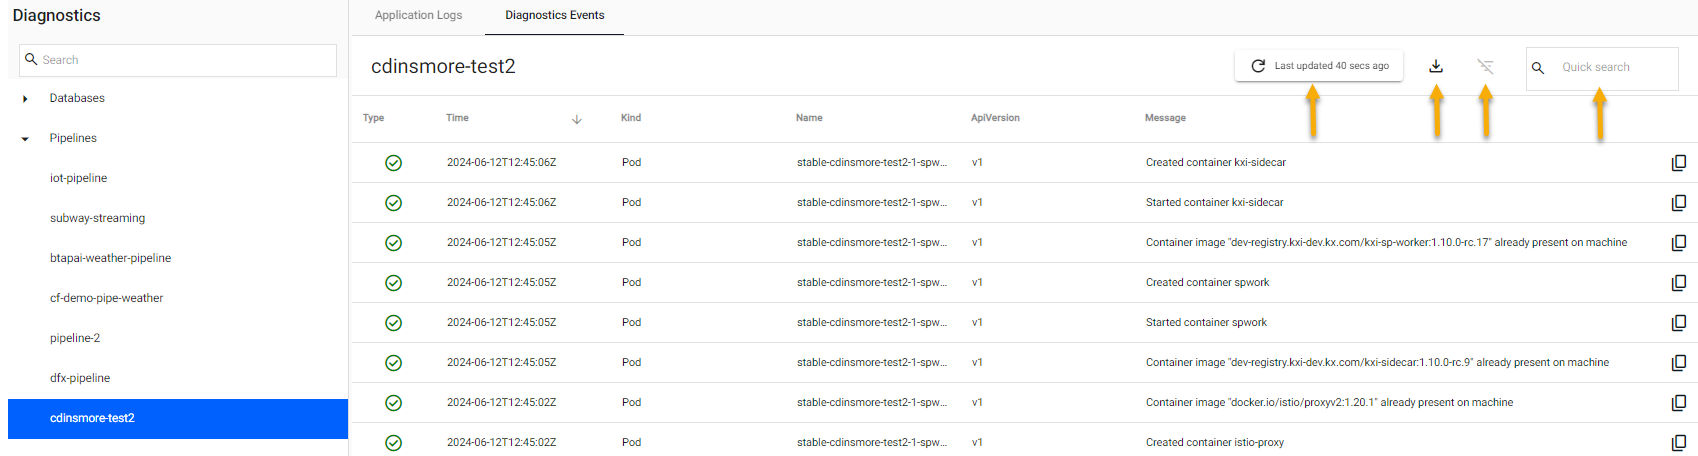
Diagnostic Events
The Diagnostic Events tab displays reported events generated by a database or pipeline deployment.
-
Results are paged.
-
Successful events are identified with a green tick.
-
Warnings are identified with a yellow tick.
-
The time since last update is displayed next to the refresh icon for both events and logs.
-
Click on a header column to sort and filter.
-
Download a '.json' report of events or logs by clicking the Download Table icon.
-
Refine your results based on a value entered in the Quick Search box.
Tip
Diagnostic data is cached; click the refresh icon to update. Alternatively, close and re-open the current tab from the ribbon menu.
Batch Ingest
The Batch Ingest tab, is displayed when you select a database from the list under Diagnostics. This tab is updated when data has been directly written to the HDB. This is done when a pipeline contains a node that writes directly to the database, see kdb Insights Database writer node for details.
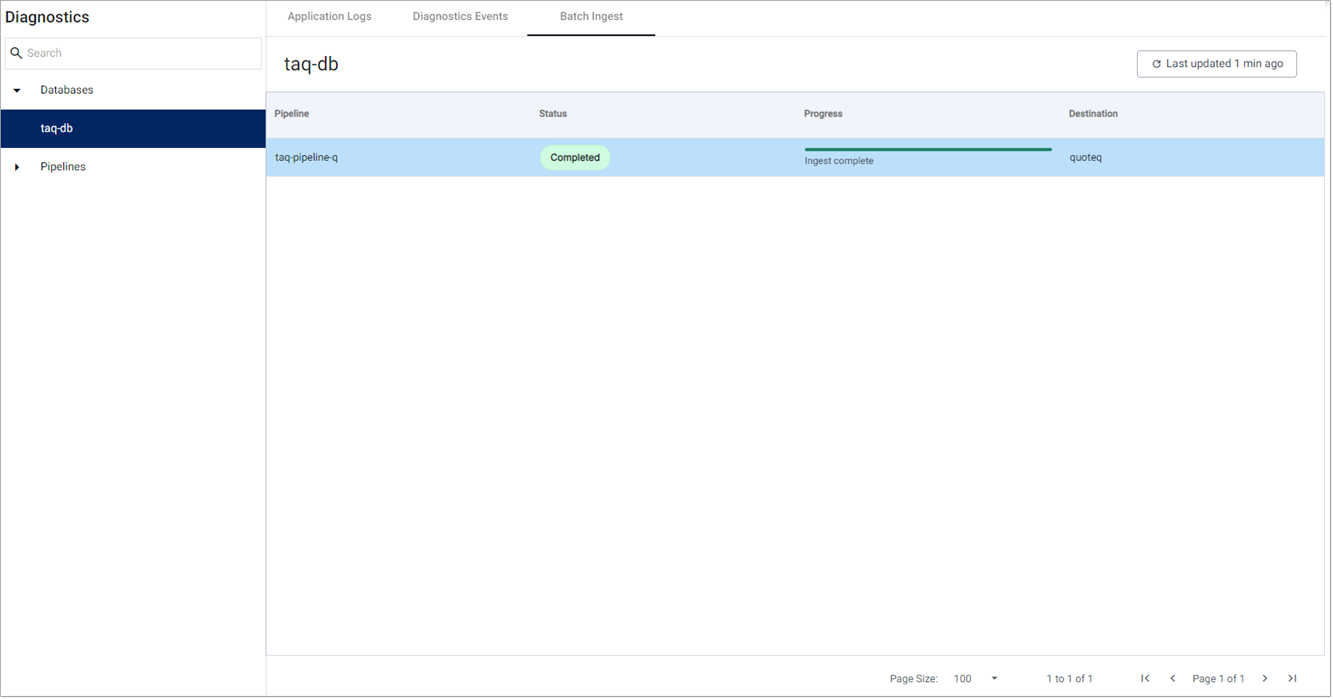
The information displayed is described in the following table.
|
Column |
Description |
|---|---|
|
Pipeline |
The name of the pipeline that is ingesting data into the database. |
|
Status |
The current status of the ingest. The values are:
|
|
Progress |
This column indicates the progress of the data ingest. The options are:
|
|
Destination |
The name of the table in this database that the data has been ingested into. |
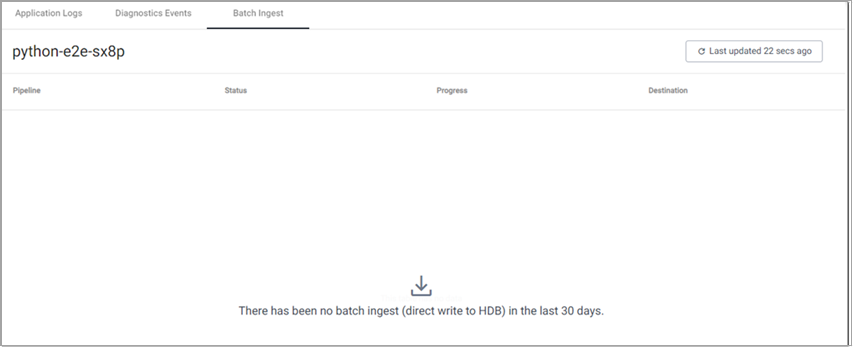
Information about data ingest is retained, in this tab, for 30 days. If the table has no data then a message is displayed saying there has been no batch ingest to the last 30 days.
System Notifications
To view system notifications:
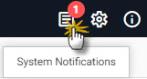
-
Click the System Notifications icon in the ribbon menu for real-time notifications of events in the current session as shown below.
-
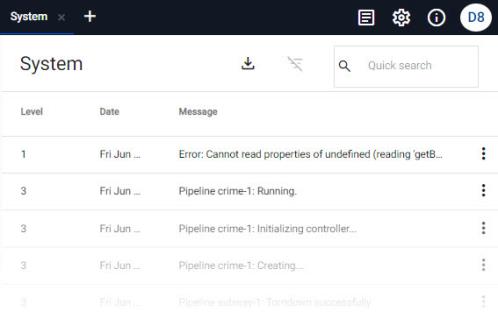
A slider panel of system notifications is displayed. You can filter results with a text search.
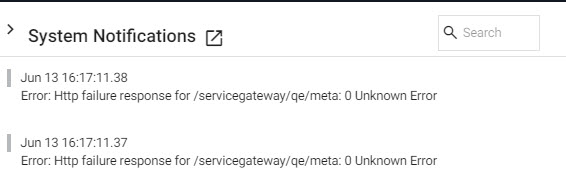
-
Click the new tab link for an expanded view of notifications.
System Settings
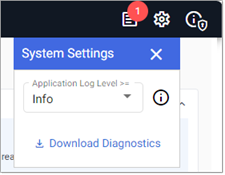
Click the System Settings icon, in top right-hand corner of the ribbon menu.
From here you can:
System log level
You can set the system log level, from the System Settings screen to one of the following; Trace, Debug, Info, Warn, Error, Fatal.
Export full system diagnostics
Warning
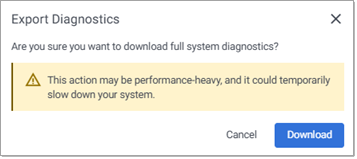
Downloading a full diagnostic report is a resource heavy process.
-
In the System Settings screen click Download Diagnostics.
Before proceeding, a warning is displayed indicating that this is a performance heavy action and asks you to confirm if you want to proceed.
-
Click Confirm to download a
.jsonfile of system notifications.
Warning
Ensure you have the appropriate Keycloak permissions to download system diagnostics.
Keycloak permissions
Diagnostics for kdb Insights Enterprise requires the appropriate Keycloak permissions.
-
Ensure you are insights.role.viewer as a minimum. This gives permission to view (but not change) all diagnostics.
Note
A Keycloak admin must assign the diagnostic roles to your user id.
The following roles are available:
|
item |
description |
|---|---|
|
|
Gives access to logs on the Application Logs tab in the diagnostics view. These logs include kdb Insights Enterprise specific informational messages and are useful for debugging a running system. |
|
|
Gives access to the Diagnostics Events tab in the diagnostics view. These logs include Kubernetes specific events and are useful for debugging startup issues. |
|
|
Allows for access to view the log levels in the level selector drop down, in System Settings. |
|
|
Allows you to change the log level across all kdb Insights Enterprise components from the Applicat/packaging/quickstart.htmlion Log Level drop down. |
|
|
When opening the diagnostics view, this provides access to view the log level that is currently set by in the "Application Log Level" drop down. |
|
|
Allows you to download the diagnostics report from your system. |
Note
Changing log levels as a diagnostic viewer
If you are an insights.role.viewer for diagnostics, you must also be an insights.role.reporter if you wish to change the log level.
For more on assigning roles in Keycloak for kdb Insights Enterprise, refer to Authentication and authorization.
Next steps
-
For further assistance contact Product Support.