Troubleshooting Pipelines
This page provides help with identifying and fixing data pipeline issues, including common errors, log analysis, and corrective steps to keep data flowing reliably.
Pipeline status
The status of a pipeline is the first indicator of where exactly in the application stack an issue is occurring. To view the status of a pipeline:
-
Go to the Overview screen.
-
The Recently Deployed panel shows the current status of each running pipeline.
The full list of possible pipeline statuses can be found here.
Here are some examples of next steps you would take given a particular scenario surrounding a status:
Pipeline is stuck in Creating
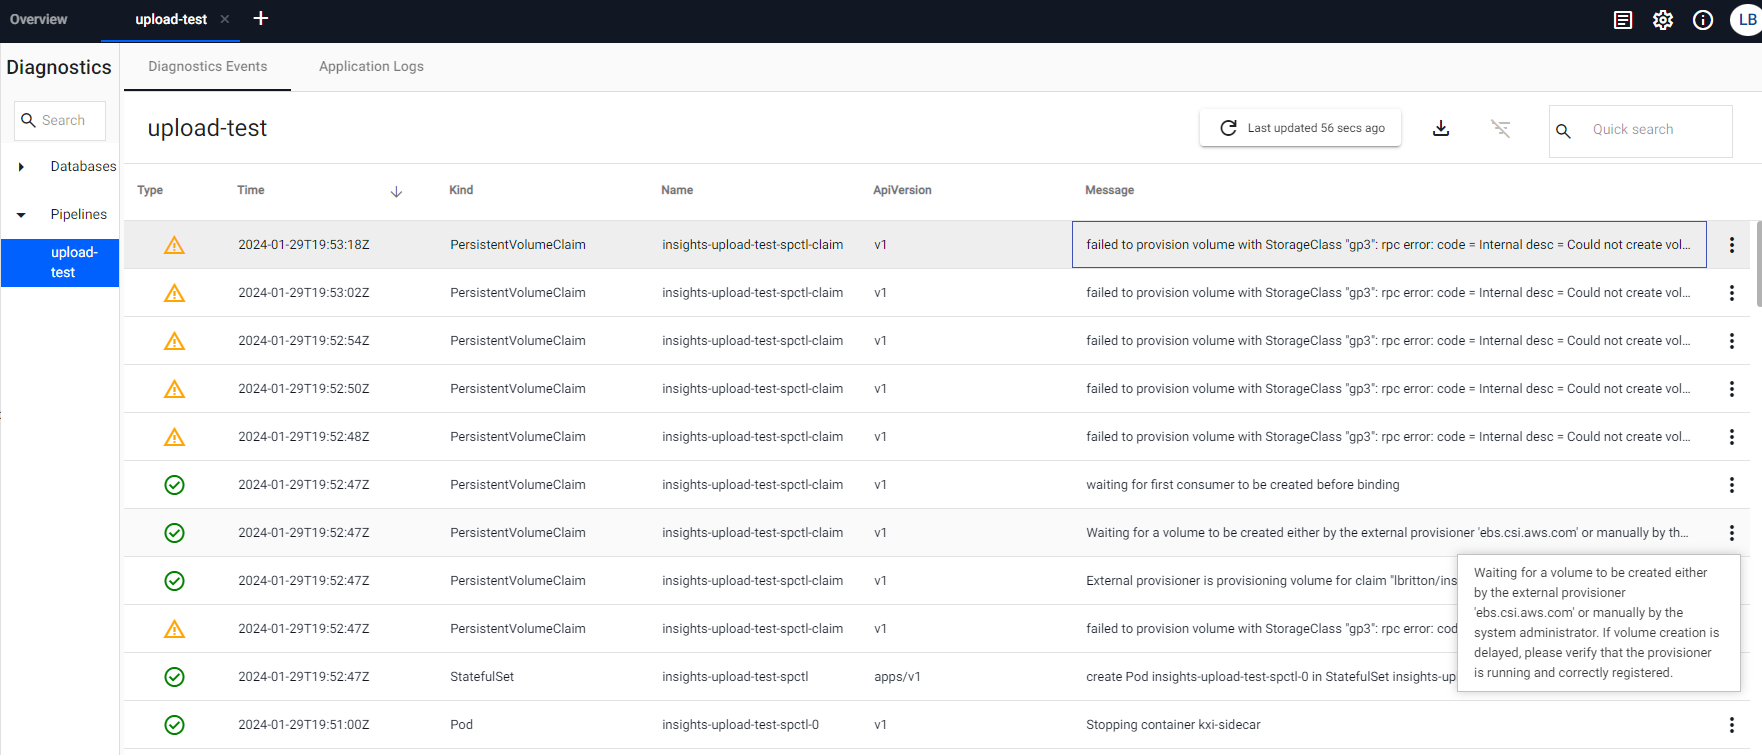
This usually implies that the SP Controller is having issues starting. A common cause of this can be that the service is waiting for a PVC request to be fulfilled. We can check if this is the case by viewing the pipelines Diagnostic Events, which gives a view of the system events that have been logged by the resources associated with the pipeline. If the pipeline is waiting on a PVC request to be fulfilled, you can expect a log message that looks something like the below:
Note
ASW specific
The following event messages are specific to a kdb Insights Enterprise install running on AWS, other cloud providers are different, and the messages themselves could also be subject to change by AWS. Please only refer to them as rough examples of what to look for.
text
"Waiting for a volume to be created either by the external provisioner 'ebs.csi.aws.com' or manually by the system administrator. If volume creation is delayed, please verify that the provisioner is running and correctly registered."
If there is a problem provisioning the volume, this event message is often followed up with an error/warning message, such as the below:
text
"failed to provision volume with StorageClass \"gp3\": rpc error: code = Internal desc = Could not create volume \"pvc-fb493355-52a0-4917-b9b3-5a77935cbeb3\": could not create volume in EC2: InvalidParameterValue: Invalid integer value -8589934591\n\tstatus code: 400, request id: fc98bdb5-596e-425c-81f7-a8c1742f619e"
In many cases, errors like this indicate a resource issue on the Kubernetes cluster. There could be numerous causes for this with some examples being;
-
The cluster has reached its PVC quota
-
The pipeline is being scheduled to an availability zone without capacity or which is not available
-
There are not enough CPU / memory resources remaining to support the workload
You should contact your system administrator to help identify the exact cause and remedy it.
Note
This issue can also occur when the pipeline is in an Unresponsive status.
Pipeline status is Errored
This indicates that the pipeline pods were able to start successfully, but the pipeline itself ran into an error when it tried to run or while it was running. In this scenario, the first step would be to investigate the logs of the pipeline. Investigating a pipeline's logs is discussed further below.
Pipeline status is Unresponsive
An unresponsive status indicates that the pipeline's SP Controller is not responding to HTTP requests. If you are seeing this status in your pipeline, click the View Diagnostics button on the pipeline to investigate.
The following can be a common cause of this status:
Secret Not Found
For readers such as Amazon S3, there is an option to specify a Kubernetes secret when Use Authentication is set to true.
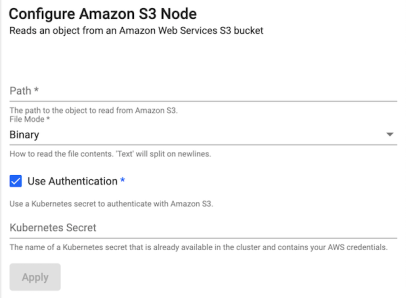
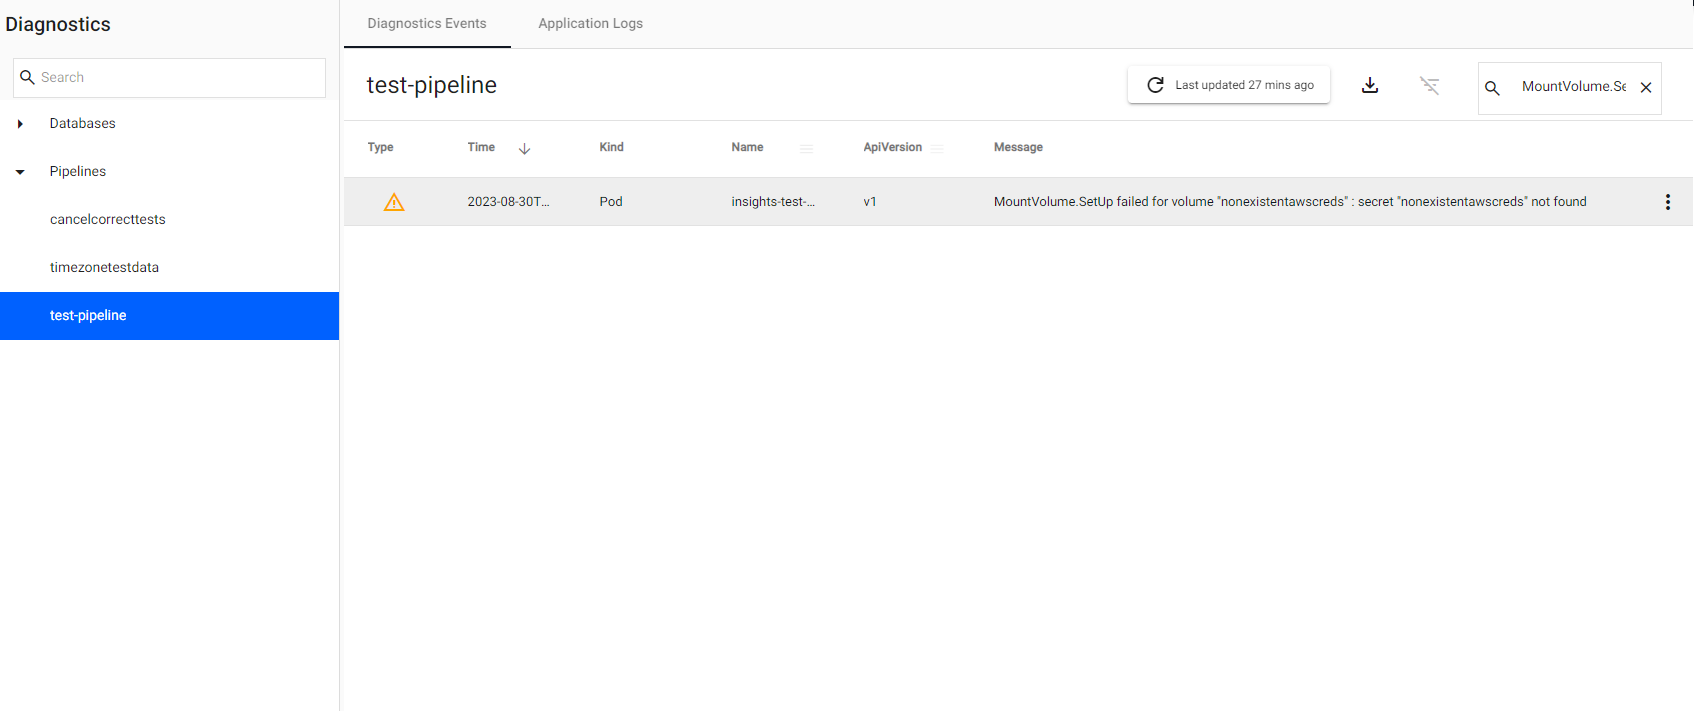
If the secret specified doesn't exist, the pipeline goes into an Unresponsive status. In such cases, if you click on View Diagnostics and go to the Diagnostic Events tab, to see the following error:
text
MountVolume.SetUp failed for volume "nonexistentawscreds" : secret "nonexistentawscreds" not found
The error can be resolved by creating the missing secret. Contact your system administrator to create this.
Once the missing secret has been created, the pipeline picks it up, move out of the Unresponsive status, and progress as normal.
Note
Secret name
The secret name nonexistentawscreds is just an example to highlight that the secret didn't exist.
Please choose a more appropriate name when naming your secrets! For example, awscreds.
Pipeline is stuck in the status Tearing down
When you teardown a pipeline, the pipeline moves into a Tearing down state. Normally the process of tearing down a pipeline is relatively quick, however sometimes it can take longer, particularly if you have selected to clear the pipeline's checkpoints, which means deleting the PVC of the SP Workers associated with the pipeline. Depending on the size of the worker PVCs, this may take a few minutes. Any longer and this may indicate that there's an issue.
A typical cause of this can be that a PVC associated with the pipeline is stuck in a Terminating state. To investigate this issue further, please contact your system administrator responsible for managing your kdb Insights Enterprise install.
Pipeline Logs
When a pipeline enters into an Errored state, the first point of action is to review the logs to see what the error is and where exactly in the flow of the pipeline it has occurred.
Viewing the Application Logs
To view the logs of a running pipeline, see here for details.
Understanding the Logs
It's one thing to know how to access the logs, but understanding their contents is the important bit! Let's dive deeper into some key characteristics of a pipeline's logs that can help with any investigation you might be undertaking:
-
Log Level : The log level columns tells the type of a log message. Let's run through each type:
INFO: Normal/expected messages for the running of a pipeline. This log level is used to provide information about significant events that occur throughout the progress of their pipeline. When debugging an issue, understanding theINFOmessages on the lead up to and after an error has occurred is important, as this gives context to where and when the error has occurred within the flow of your pipeline.WARN: This log level is used to warn you that something has occurred that may impact the pipeline's ability to run successfully, either now or in the future. Messages of this type should be treated as a foreshadowing for potential future errors or unexpected behaviour.ERROR: This log level is used to inform you that a significant error condition has been triggered or the application has ran into unexpected behaviour that has caused the pipeline's code to error. Typically error messages are indicative of a loss of application functionality or data (although that data is likely recoverable).FATAL: This log level indicates that a highly significant error has occurred which either has resulted or results (if the pipeline continues) in the unrecoverable loss of data and/or functionality.DEBUG: This log level is used to relay important events throughout the running of a pipeline, but at a more granular and technical level than theINFOlog level. By default messages at this log level are not published, as they create noise and unnecessary bloat in the log files. See below for how to enable them.TRACE: This log level is used to capture and log data as it flows through the operators of a pipeline. Like theDEBUGlog level,TRACEmessages are not published by default, as they are intended for debugging purposes only, and would otherwise bloat the log files during normal operation. See below for how to enable.
-
Container : The container column of the logs indicates which container the log message came from. For a pipeline, there are 2 types of containers you should be aware of:
spctl: This is the container for the SP Controller, which is responsible for spinning up workers and generally managing the state of a pipeline as it progresses from setup to starting to running to finished. Each pipeline has 1 and only 1 SP Controller. Typically an error in this container is indicative that there was an issue setting up or starting the SP Workers associated with the pipeline.spwork: This is the container for the SP Worker, which is responsible for actually running the operators you have configured for your pipeline. By default, a pipeline has 1 SP Worker, but this can be increased in the pipeline's settings. An error in this container typically indicates that an operator in your pipeline has thrown an error. Heavily dependent on the error itself, but as a general tip the first steps when investigating an error in the SP worker are to review your pipeline configuration and the data being ingested.
-
Pod : The pod column tells us which Kubernetes pod the log message is from. Filtering on this column can be useful when you want to review the log messages for an individual SP worker.
-
Time Time the logged event occurred.
-
Component: The component that the log message came from.
-
Message: The log message itself.
Column Filters
To filter one of the columns in the Application Logs do the following:
-
Go to the Application Logs.
-
Hover over the name of the column you would like to filter.
-
3 Horizontal bars appears to the right of the column name. Click on the horizontal bars.
-
A pop-up box appears with a drop-down containing filter rules you can apply and a text box where you can enter the text you want to filter on. Select a rule and enter the text to filter on. As you type you'll notice a secondary dropdown and text box pops-up along with AND/OR radio buttons. Use these if you wish to add an additional rule to your filtering, otherwise ignore.
-
The filter is applied in real-time as you type. The log messages are filtered based on the rule you apply.
How to turn on Debug Logging
To turn on debug or trace logging before a pipeline has been started do the following:
-
Go to the Overview screen.
-
In the side panel on the left-side click Pipelines.
-
Click on the pipeline you're planning to start with debug or trace logging enabled.
-
Click on the Settings tab.
-
Under the Runtime section there is a drop-down for Log Level. Select
Debugto turn on debug logging orTraceto turn on trace logging. -
Click Save & Deploy to run the pipeline with the new settings.
-
Go to the Application Logs to see additional Debug or Trace (depending on which you enabled) logging along with regular log messages.
To turn on debug or trace logging when a pipeline is already running do the following:
-
Go to the Overview screen.
-
Click on the settings widget in the top right corner of the screen.
-
In the Application Log Level drop-down select
Debugto turn on debug logging orTraceto turn on trace logging. -
Go to the Application Logs to see additional Debug or Trace (depending on which you enabled) logging along with regular log messages.
Understanding logs
When investigating an error in a pipeline, understanding the context of the log messages surrounding an error can be just as important as understanding the error itself. This is because the surrounding messages provide information about where exactly in the flow of the pipeline the error occurred. To get a better grasp of this, let's walkthrough some key log messages that occur throughout the lifecycle of a healthy pipeline:
SP Controller expected log messages
When a new pipeline is kicked off, the first thing that is started is a new SP Controller, which is assigned to the new pipeline for the duration that it is running. Here are some of the key log messages you can expect from the SP Controller:
-
Spawning %n workersThe first major action the controller takes after loading its configuration settings is to begin spawning the SP Workers that runs the pipeline. This log message tells you that this action has begun and tells you how many workers it plans on spawning (
%nis replaced by the number of workers being spawned). -
Spawned worker, name=%s1, addr=%s2This log message let's us know that the controller has successfully made a request to the Kubernetes Control Plane to create a new worker. Here
%s1is replaced by the name of the pod for the new worker and%s2is replaced by the host and port (i.e. address) of the worker process running within the worker pod. It should be noted that this log message does not necessarily indicate that the worker pod has started successfully, it simply informs us that the Kubernetes Control Plane has accepted the request for new resources to be created. -
Initializing worker %s, handle=%nThis log message signifies that a worker pod has successfully started and has sent a request to the register with the controller. The controller responds by 'initializing' that worker by passing the details of the pipeline graph the worker is expected to run. Here
%sis replaced by the name of the worker pod and%nis replaced by the TCP/IP handle/socket connection that the controller has opened to this worker. -
Starting all registered workersOnce all workers have successfully registered and been initialized, the controller sends a message to each registered worker to begin running the pipeline graph they were sent during the initialization phase.
-
All workers startedThis log message indicates that all workers have successfully started their pipeline graph and the pipeline overall is now in a
Runningstate.
SP Worker expected log messages
The SP Worker is started by the SP Controller, as discussed above, and is responsible for actually running the pipeline. Here are some of the key log messages you should expect from a SP Worker (remember that there can be more than 1 worker running depending on configuration):
-
Successfully connected to parent, addr=%s, handle=%nThe first action a worker takes is to connect to its parent process i.e. the controller. You should look for this log message to confirm that a worker was able to successfully connect to the controller. Once connected, the worker sends a message to the controller requesting to register with it. Here
%sis replaced by the host and port (i.e. address) of the controller process running within the controller pod and%nis replaced by the TCP/IP handle/socket connection that the worker has opened to the controller. -
Initializing workerAs part of registration, the controller sends the worker the pipeline graph it is expected to run. The worker stores this pipeline graph it receives in preparation for setting up and running the pipeline.
-
Finished worker initializationIndicates the initialization phase is complete and was successful.
-
Setting up pipeline...After initialization, the worker enters into a setup phase, where it uses the pipeline graph it had previously stored to setup each operator in the pipeline.
-
Finished pipeline setupIndicates the setup phase is complete and was successful.
-
Starting readers...Signifies that all workers have now successfully completed registration with the controller, and the controller has therefore sent a message to each worker to start their pipeline readers (which equals starting the pipeline).
-
Pipeline started successfullyReaders started successfully and the pipeline is now running.
Quick/Full Test
Another useful tool that can help in an investigation of an Errored pipeline is the Quick/Full Test utility. This utility allows you to spin up a test version of a pipeline for debugging. This test pipeline has data tracing enabled, meaning the data inputs and outputs of each pipeline node is logged. You can read more about test deploys here.