Dashboard Performance Monitoring
This page provides insight into the runtime performance of dashboard queries. It shows how queries behave while dashboards are actively in use, helping teams identify slow, failing, or timed-out queries before they impact end users.
Dashboard Performance Monitoring captures query execution metrics based on real user activity, enabling teams to diagnose issues quickly and track performance trends over time.
This information helps teams understand how individual queries contribute to overall dashboard performance.
Why this is useful
Dashboards often depend on multiple queries and data sources. If one query performs poorly, it can slow down or break the entire dashboard. Without performance monitoring, these issues are typically discovered only after users report problems.
Query performance monitoring
Query performance monitoring is useful because it:
-
Measures execution time for each dashboard query
-
Identifies slow-running queries
-
Surfaces failed or timed-out queries
-
Helps pinpoint queries that require optimization
By providing visibility into query behavior at runtime, it allows you to address performance issues proactively instead of reactively.
Key benefits
Using Dashboard Performance Monitoring, you can:
-
Quickly identify which queries are impacting overall dashboard performance
-
Investigate issues as they occur, rather than relying on user reports
-
Capture performance data while dashboards are actively in use
-
Reflects real-world usage rather than test or synthetic runs
-
Perform live diagnostics when dashboards become slow or unresponsive
How to access Dashboard Performance Monitoring
-
Open the menu icon in the top-left corner of the dashboard
-
Navigate to Queries
-
Select Testing Page
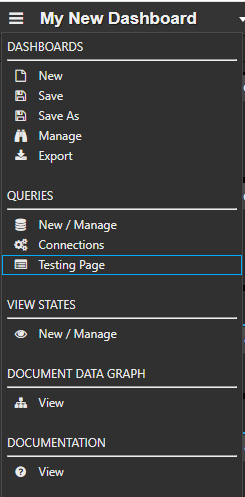
The Testing Page displays performance information for dashboard queries, allowing you to monitor execution behavior while dashboards are in use.
Next steps
-
Learn how to add Google Analytics to Dashboards.