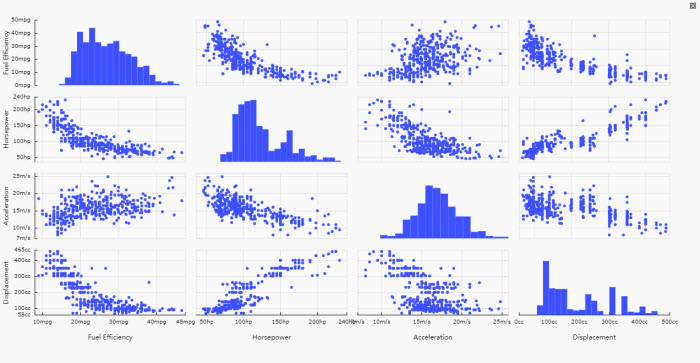
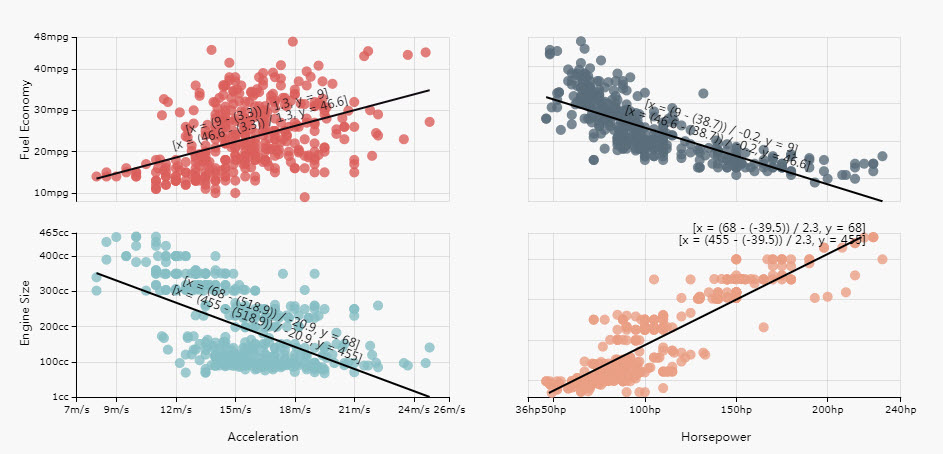
ScatterPlot Matrix
This page describes how to set up and configure the ScatterPlot Matrix component, a matrix for plotting two or more variables against one another.
Set up a ScatterPlot Matrix
To set up a ScatterPlot Matrix component, click-and-drag the component into the workspace and configure the following:
-
Assign a data source.
-
Select between
quartetormatrixChart Type. -
Configure your Column Name per plotted item in a
matrix, or X Axis and Y Axis Data per chart n in a quartet plot.
Refer to ScatterPlot Matrix properties described in the next section for details on additional properties.
ScatterPlot Matrix properties
The following sections provides details on how to configure the properties of the ScatterPlot Matrix component.
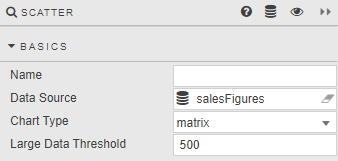
Basics
Open the Basics properties on the right and configure the properties described in the following table.
|
Field |
Description |
|---|---|
|
Name |
A name for the component provided by the user. |
|
Data Source |
|
|
Chart Type |
Switch between |
|
Large Date Threshold |
This is the number of data points per chart, above which performance optimizations kick-in; restricting some of the available functionality. |
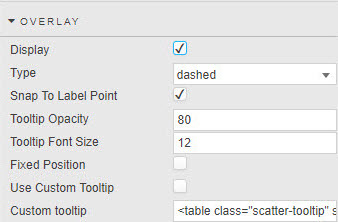
Overlay
Configure the properties described in the following table.
|
Field |
Description |
|---|---|
|
Display |
Toggles display of tooltip. |
|
Type |
Define crosshair style. |
|
Snap to Label Point |
When enabled, tracks plotted points. |
|
Tooltip Opacity |
|
|
Tooltip Font Size |
Style Crosshair. Opacity is a value between 0 and 100. |
|
Fixed Position |
Anchors overlay to the corner. |
|
Use Custom Tooltip |
Defines data to display in the overlay. |
|
Custom Tooltip |
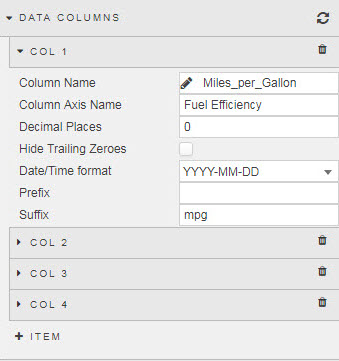
Data columns
The properties displayed vary depending on the Chart Type selected in the Basics properties.
Matrix
Column
|
Field |
Description |
|---|---|
|
Column Name |
Assigned from Data source. |
|
Column Axis Name |
Text description name for the axis. Formatted in Title. |
|
Decimal Places |
Number of decimal places for axis values. |
|
Hide Trailing Zeroes |
Remove trailing zeroes. |
|
Date/Time Format |
Use when Format is set to |
|
Prefix |
Additional text label to apply before or after label value. |
|
Suffix |
Quartet
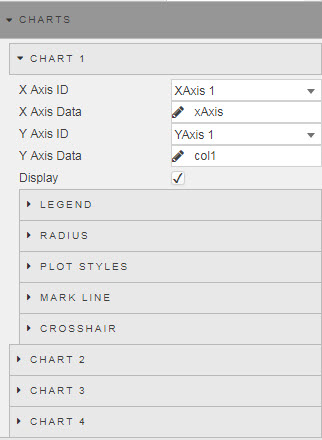
Charts
|
Field |
Description |
|---|---|
|
X Axis ID |
Define data source data for x-axis. |
|
X Axis Data |
|
|
Y Axis ID |
Define data source data for y-axis. |
|
Y Axis Data |
|
|
Display |
Toggle display of chart. If only a single scatter plot is required, uncheck display of Charts 2,3 and 4. |
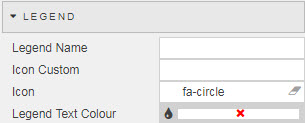
Legend
|
Field |
Description |
|---|---|
|
Legend Name |
Text name of Legend. |
|
Legend Color |
Color of Legend. |
|
Icon Custom |
Set icon to a vector path. Note Icon custom does not supportarrow or image://url.
|
|
Icon |
Define Legend icon shape. |
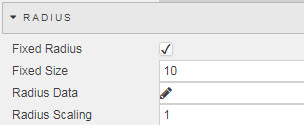
Radius
|
Field |
Description |
|---|---|
|
Fixed Radius |
Enable and define fixed bubble size. |
|
Fixed Size |
|
|
Radius Data |
Assign radius to a data source variable |
|
Radius Scaling |
Apply a scaling to the radius data variable. |
Plot styles
|
Field |
Description |
|---|---|
|
Plot Shape |
Select from |
|
Plot Color |
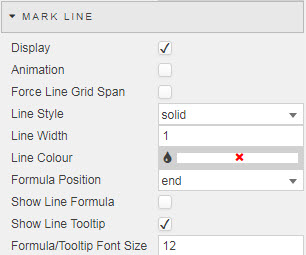
Mark line
|
Field |
Description |
|---|---|
|
Display |
Enable trend (best-fit) line. |
|
Animation |
Include draw animation of line. |
|
Force Line Grid Span |
Mark line extends to edge of chart. |
|
Line Style |
Style Mark Line.
Select from |
|
Line Width |
|
|
Line Color |
|
|
Formula Position |
Select where the line equation is anchored from |
|
Show Line Formula |
Display the equation of line on chart. |
|
Show Line Tootlip |
Display the equation of line in tooltip. |
|
Formula/Tooltip Font Size |
Set the font size for line equation. |
Crosshair

|
Field |
Description |
|---|---|
|
Format |
Define data type: |
|
Decimal Places |
Define Format precision for |
|
Hide Trailing Zeroes |
Remove trailing zeroes. |
|
Label Display Interval |
Set frequency of label display. |
|
Date/Time Format |
Use for |
X axes
The properties displayed vary depending on the Chart Type selected in the Basics properties.
Matrix
The axes name is inherited from Column Axis Name in Matrix Col (Data Columns).
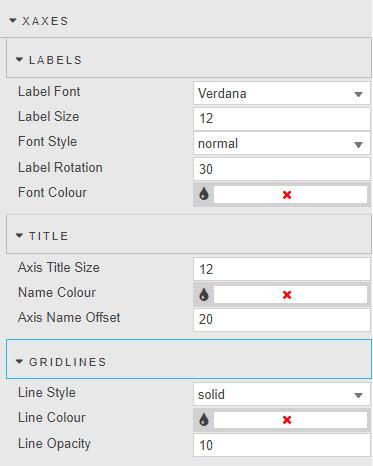
Labels
|
Field |
Description |
|---|---|
|
Label Font |
Select from |
|
Label Size |
Font size for x-axes label in pixels. |
|
Font Style |
Choose from |
|
Label Rotation |
Set angle for X-axes tick value labels. |
|
Font_Color |
Set font color. |
Title
|
Field |
Description |
|---|---|
|
Axis Title Size |
Font size for X-axes label. |
|
Name Color |
Format color of X-axes label. |
|
Axis Name Offset |
Pixel distance between axes values and axes label. |
Gridlines
|
Field |
Description |
|---|---|
|
Line Style |
Gridline style; select from
Opacity is a value between 0 and 100. |
|
Line Opacity |
|
|
Line Color |
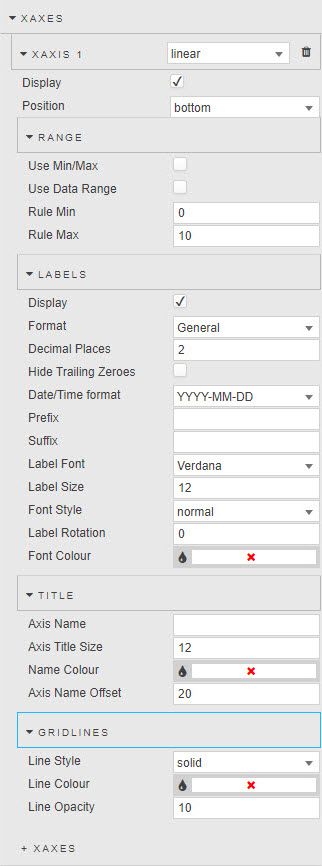
Quartet
Select between linear, category, logarithmic, and time
|
Field |
Description |
|---|---|
|
Display |
Toggle position of axes. |
|
Position |
Set position of X axes at |
Range
|
Field |
Description |
|---|---|
|
Use Min/Max |
Toggle and set range of X-axes minimum and maximum values. |
|
Rule Min |
|
|
Rule Max |
|
|
Use Data Range |
Use plotted data to define minimum and maximum value of quartet chart range. |
Labels
|
Field |
Description |
|---|---|
|
Display |
Toggle display of X axes. |
|
Format |
Select data type from |
|
Decimal Places |
Define number of decimal places for |
|
Hide Trailing Zeroes |
Remove zeroes at the end of |
|
Date/Time format |
Select from dropdown the date and/or time format when |
|
Prefix |
Add text element to axes label before or after value. |
|
Suffix |
|
|
Label Font |
Select from |
|
Label Size |
Font size for X axis label in pixels. |
|
Font Style |
Choose from |
|
Label Rotation |
Set angle for X-axes tick value labels. |
|
Font_Color |
Set font color. |
Title
|
Field |
Description |
|---|---|
|
Axis Name |
Text label used for X axis. |
|
Axis Title Size |
Font size for X-axis label. |
|
Name Color |
Format color of X-axis label. |
|
Axis Name Offset |
Pixel distance between axis values and axis label. |
Gridlines
|
Field |
Description |
|---|---|
|
Line Style |
Gridline style; select from
Opacity is a value between 0 and 100. |
|
Line Opacity |
|
|
Line Color |
Y axes
The properties displayed vary depending on the Chart Type selected in the Basics properties.
Matrix
Labels
|
Field |
Description |
|---|---|
|
Label Font |
Select from |
|
Label Size |
Font size for Y-axis label in pixels. |
|
Font Style |
Choose from |
|
Label Rotation |
Set angle for Y-axis tick value labels. |
|
Font_Color |
Set font color. |
Title
|
Field |
Description |
|---|---|
|
Axis Title Size |
Font size for Y-axis label. |
|
Name Color |
Format color of Y-axis label. |
|
Axis Name Offset |
Pixel distance between axis values and axis label. |
Gridlines
|
Field |
Description |
|---|---|
|
Line Style |
Gridline style; select from |
|
Line Width |
|
|
Line Color |
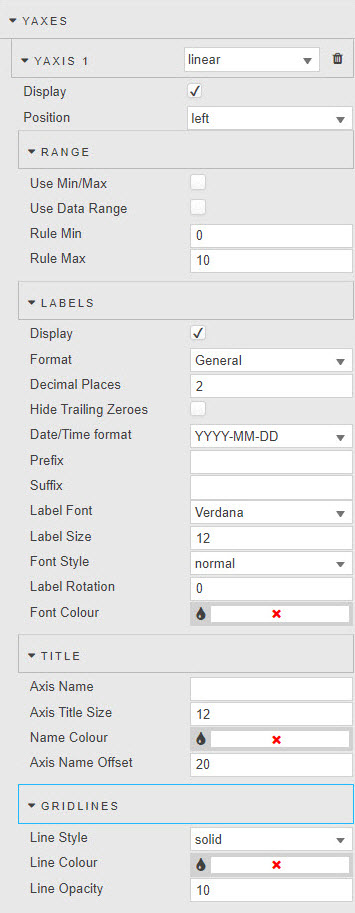
Quartet
Select between linear, category, logarithmic, and time.
|
Field |
Description |
|---|---|
|
Display |
Toggle position of axis. |
|
Position |
Set position of Y axis at |
Range
|
Field |
Description |
|---|---|
|
Use Min/Max |
Toggle and set range of Y-axis minimum and maximum values. |
|
Rule Min |
|
|
Rule Max |
|
|
Use Data Range |
Use plotted data to define minimum and maximum value of quartet chart range. |
Labels
|
Field |
Description |
|---|---|
|
Display |
Toggle display of Y axis. |
|
Format |
Select data type from |
|
Decimal Places |
Define number of decimal places for |
|
Hide Trailing Zeroes |
Remove zeroes at the end of |
|
Date/Time format |
Select from dropdown the date and/or time format when |
|
Prefix |
Add text element to axis label before or after value. |
|
Suffix |
|
|
Label Font |
Select from |
|
Label Size |
Font size for X-axis label in pixels. |
|
Font Style |
Choose from |
|
Label Rotation |
Set angle for X-axis tick value labels. |
|
Font_Color |
Set font color. |
Title
|
Field |
Description |
|---|---|
|
Axis Name |
Text label used for Y axis. |
|
Axis Title Size |
Font size for Y-axis label. |
|
Name Color |
Format color of Y-axis label. |
|
Axis Name Offset |
Pixel distance between axis values and axis label. |
Gridlines
|
Field |
Description |
|---|---|
|
Line Style |
Gridline style; select from
Opacity is a value between 0 and 100. |
|
Line Opacity |
|
|
Line Color |
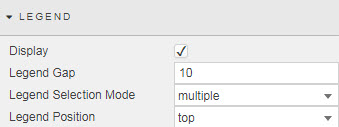
Legend
These properties only apply to Quartet charts.
Configure the properties described in the following table.
|
Field |
Description |
|---|---|
|
Display |
Toggle header legend. |
|
Legend Gap |
Pixel width between legend labels. |
|
Legend Selection Mode |
Select from |
|
Legend Position |
Select from |
Style, Margins and Format
Configure the properties described in the following table.
|
Field |
Description |
|---|---|
|
Matrix Axis Padding |
Set Padding around axis labels |
|
Matrix Enable Brush Tools |
Cross chart highlight rules for data |
Refer to Style for common settings.