MapboxMap
This page describes how to set up and configure the MapboxMap component to display a geographical map that can contain a 3D overlay.
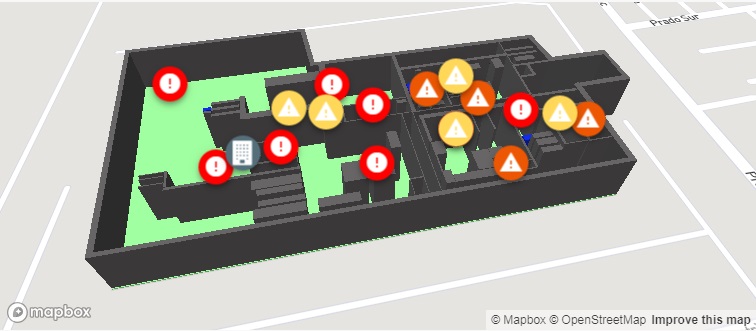
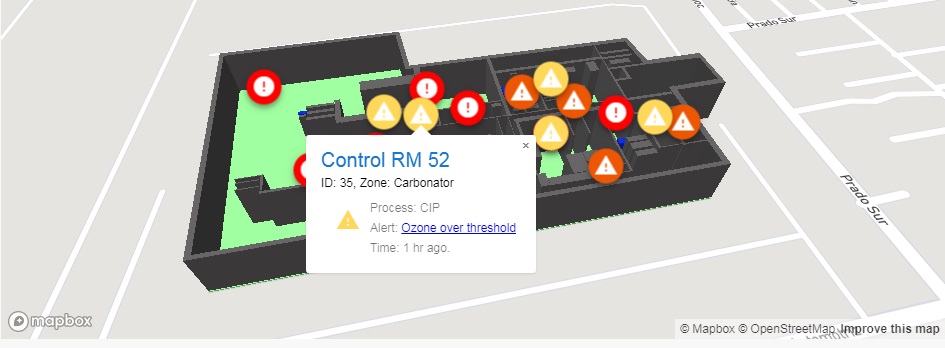
The following screenshots shows a map with a 3D Overlay.
Set up a MapboxMap
To set up a MapboxMapcomponent, click-and-drag the component into the workspace and configure the following:
-
Define a data source with Latitude, Longitude, Marker Type, Title, Sub Title, Color, and Icon data.
-
Set JSON overlay for map polygon image.
-
Set the API access token in Map Box Key.
-
Create optional view state parameters for map elements.
Refer to MapboxMap properties described in the next section for details on additional properties.
MapboxMap properties
The following sections provides details on how to configure the properties of the MapboxMap component.
Basics
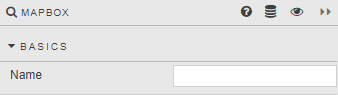
Open the Basics properties on the right and configure the properties described in the following table.
|
Field |
Description |
|---|---|
|
Name |
Enter a name for the component. |
Map
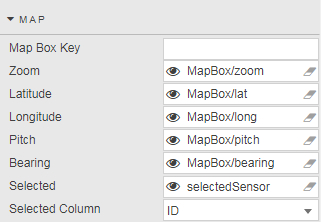
Configure the properties described in the following table.
|
Field |
Description |
|---|---|
|
Map Box Key |
Access token for the API. |
|
Zoom |
The map’s current zoom level. |
|
Latitude |
The latitude for the map’s geographical centre point. |
|
Longitude |
The longitude for the map’s geographical centre point. |
|
Pitch |
The map’s current tilt level. |
|
Bearing |
The map’s current rotation level. |
|
Selected |
Refer to Selected values for details. |
|
Selected Column |
The column used for the selected attribute. |
Points
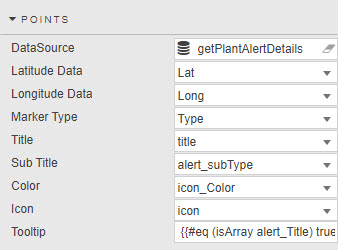
You can plots distinct data points on the map by configuring the properties described in the following table.
|
Field |
Description |
|---|---|
|
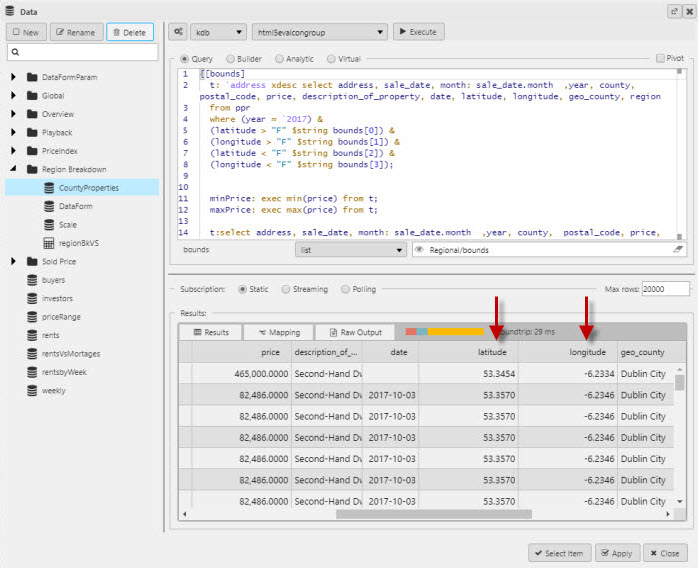
Latitude / Longitude |
Data Source columns for latitude and longitude.
The following example shows latitude and longitude columns in the Data Source.
|
|
Marker Type |
Data Source columns for a standard point or a simplified point. |
|
Title / Sub Title |
Data Source columns for point title and sub title. |
|
Color / Icon |
Data Source columns for point color and icon. |
|
Tooltip |
The following shows a tooltip on a Mapbox. Refer to Custom tooltips for details.
|
Overlay
Configure the properties described in the following table.
|
Field |
Description |
|---|---|
|
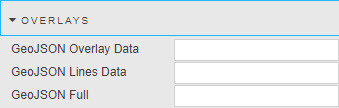
GeoJSON Overlay Data |
Define the JSON source for polygon overlays. For example: JSON Copy
|
|
GeoJSON Line Data |
The JSON line overlay. For example: JSON Copy
|
|
GeoJSON Full |
A combination of GeoJSON sources – displays all. For example: JSON Copy
|
Style, Margins, Format
Refer to Style for common style settings.