kdb Insights Enterprise Power Query Connector
This page describes how to import data from kdb Insights Enterpriseinto Power BI.
The certified kdb Insights Enterprise Power Query Connector supports the Import data connectivity mode.
The connector enables Microsoft Power BI users to remotely connect, explore, query data, preview tables, and harness the power and performance of kdb Insights Enterprise analytics before importing datasets into Power BI for visualization.
Prerequisites
Ensure the following prerequisites are met before proceeding.
-
kdb Insights Enterprise 1.11.0 or above is installed and running at least one database.
-
Permissions to query data on the running databases.
-
Access to either:
-
Power BI Desktop
-
Power BI Online
-
Note
Data LimitsThe amount of data that the Connector can import is determined by the version of Power BI.
Connect
To connect Power BI Desktop or Power BI Online to kdb Insights Enterprise and import data, take the following steps:
-
Open Microsoft Power BI Desktop or Power BI Online.
-
Open the Get Data screen:
-
For Power BI Desktop, click Get Data -> More from the Home tab in the upper ribbon.
-
For Power BI Online, in the Get Data experience, select the
Dataflowcategory. Refer to Creating a dataflow for instructions.
-
-
Enter
KX kdbinto the search box. -
Select
KX kdb Insights Enterprise. -
Click Connect.
-
Enter the
Hostname, or URL for your kdb Insights Enterprise deployment.Note
To get the hostname from an Azure Marketplace deployment
-
Access the Resource group in the Azure Portal and select the
kdbInsightsEntcluster.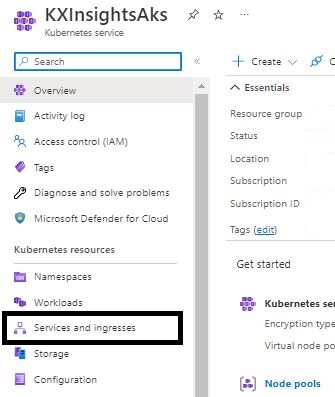
-
Select Services and Ingresses from the left panel under Kubernetes resources.
-
Select the Ingresses tab.
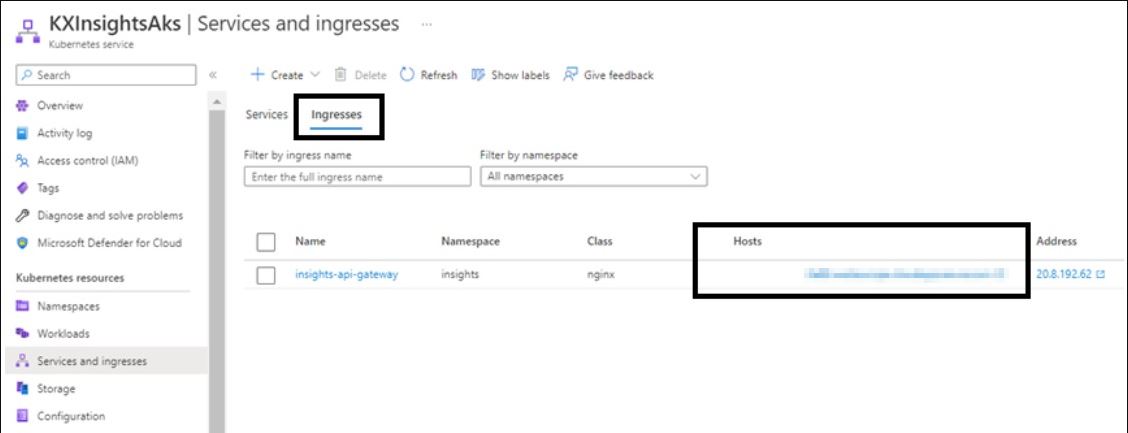
-
Copy the value in the Hosts column which like this:
xxxx.someregion.cloudapp.azure.com
-
-
Click OK.
-
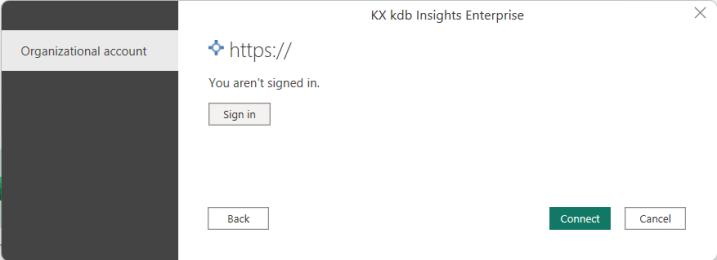
You are prompted to sign in if you have not signed in recently or have never signed in:
-
Click Sign in. The button is named Sign in as a different user if your login credentials have expired or are no longer valid.
-
To sign into kdb Insights Enterprise, either:
-
Enter your Username and Password, or
-
Click Microsoft Entra ID if Microsoft Entra integration is enabled.
-
-
If your credentials are valid, the Connector popup displays that you are currently signed in and you can click Connect.
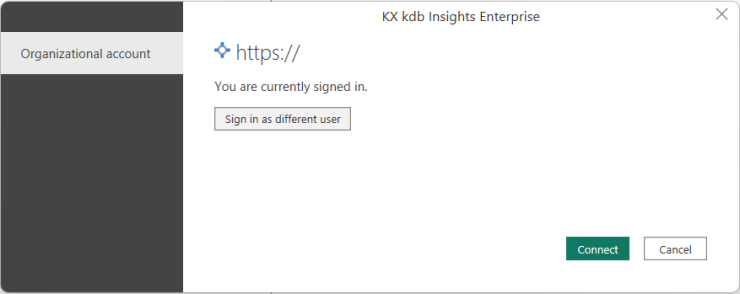
-
-
The Navigator dialog box displays all the running databases and tables for your chosen host on the left. Clicking on a table returns a preview of the selected data using the kdb Insights Enterprise getData REST API.
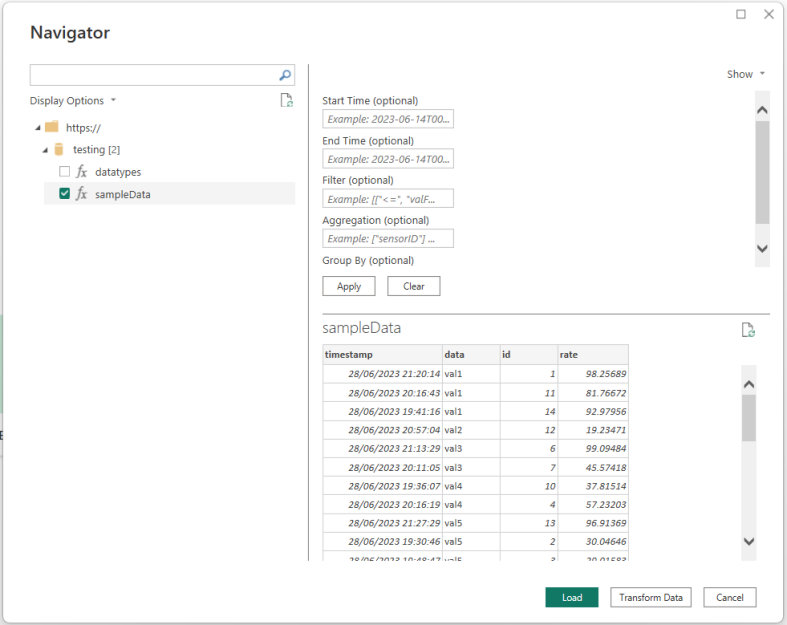
-
Enter the parameters (see table below) and click Apply. This allows you to leverage the power of kdb Insights Enterprise analytics to filter, group, and aggregate via the the kdb Insights Enterprise getData REST API before importing the data. This restricts the data being loaded and brings you the performance of the kdb Insights database.
Parameter
Details
Applies to the partitioned column and are ignored for non-partitioned tables
Applies to the partitioned column and are ignored for non-partitioned tables
Filters out certain rows
Filters the columns and/or aggregates the rows being returned
Group the results of an aggregation based on specific columns
These parameters are described in more detail here.
Note
We recommend that you set a start and end time for partitioned tables to avoid running queries across the entire dataset. -
After defining the parameters you require, choose to either:
-
Transform Data: To open the Power Query Editor window and transform the data further. See here for details on the Power Query Editor.
-
Load: To load the data without any further transformations. After loading the data you can still modify a query using the Power Query Editor if required.
-
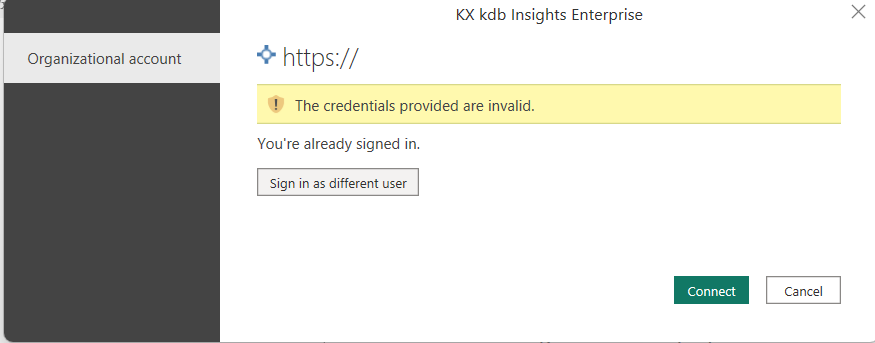
Note
Inactivity message
The credentials provided are not invalid, to resolve this click Sign in as a different user and use the same credentials as before to validate your existing.
credentials.
Note
Power BI Desktop - caching
Once you enter your credentials for a particular kdb Insights Enterprise deployment, Power BI Desktop caches and reuses those same credentials in subsequent connection attempts.
You can modify those credentials by going to File > Options and settings > Data source settings.
Parameters
This section describes how the parameters can be applied in the Navigator dialog box.
Note
The following parameters are a subset of those available for the getData REST API.Start and End Time
The Start and End time parameters filter the partitioned field on a partitioned table using the times specified where:
-
Start Time is the inclusive start time of the period of interest.
-
End Time is the exclusive end time of period of interest.
Note
Use ISO 8601 times of the format: +%Y-%m-%dT%H:%M%:%S, for example 2024-01-01T00:00:00.
Warning
If the table is splayed, these time parameters are ignored.
If you specify a date with an incorrect format, the Apply button is disabled and a warning displays asking you to input a DateTime value.
Information
Missing Start Time or End Time parameters.
-
The parameters should must both be defined or both be empty. For example, if the Start Time is set but not the End Time an error is displayed.
-
When one or more of the other parameters are defined, both the Start Time and End Time parameters must be defined, or an error is displayed.
Filter
The Filter parameter specifies the filtering options to be applied before returning the data. The documentation here shows details of all the filtering options that can be applied.
The parameter is specified as a list of triples, where each triple has the form ["operator", "column name", values]. The available operators are documented here.
Note
When the Filter parameter is provided the Start and End Time parameters must also be specified.
Examples:
|
Description |
Parameter value |
|---|---|
|
|
[["<=", "id", 10]] |
|
|
[["within", "id", [10,20]]] |
|
|
[["and",[">", "id", 10],["<", "rate", 80]]] |
Aggregation
The Aggregation parameter specifies the columns and/or aggregations to return after selecting the data. The documentation here shows details of the options that can be applied.
The parameter is either specified as:
-
A list of symbols
["column name1", "column name2"]to only return the chosen columns. -
A list of lists of symbols
[,["new column name1", "operator1", "column name"],["new column name2", "operator2", "column name2"]]to return aggregates with new names.
The available operators are documented here.
Note
When the Aggregation parameter is provided the Start and End Time parameters must also be specified.
Examples:
|
Description |
Parameter Value |
|---|---|
|
Only return the |
["data", "id"] |
|
The average |
[["avgrate", "avg", "rate"],["minid", "min", "id"]] |
Group By
The Group By parameter must be used in conjunction with Aggregation parameter to perform aggregations across column values. The documentation here shows details of the options that can be applied.
The parameter is specified as a list of symbols ["column name1", "column name2"].
Note
When the Group By parameter is provided the Start Time, End Time, and Aggregation parameters must also be specified.
Examples:
|
Description |
Aggregation parameter |
Group by parameter |
|---|---|---|
|
The average |
[["avgrate", "avg", "rate"]] |
["id"] |
|
The number of records and the average |
[["countperid", "count", "id"],["avgrate", "avg", "rate"]] |
["id"] |
Modifying an existing query
Once you have defined a query you can edit the parameters of a query in the Power Query Editor using Navigation within Applied Steps.
In Power BI Desktop:
-
Select the query from the Data right hand panel.
-
Click on the ellipsis
...and selecting Edit query to open the Power Query Editor. -
Select Navigation in the Applied Steps section of the Query Settings panel, as shown here.
-
The central pane displays the same parameters as those available in the Get data flow, with the benefit of date pickers for Start Time and End Time and larger text boxes for the other parameters.
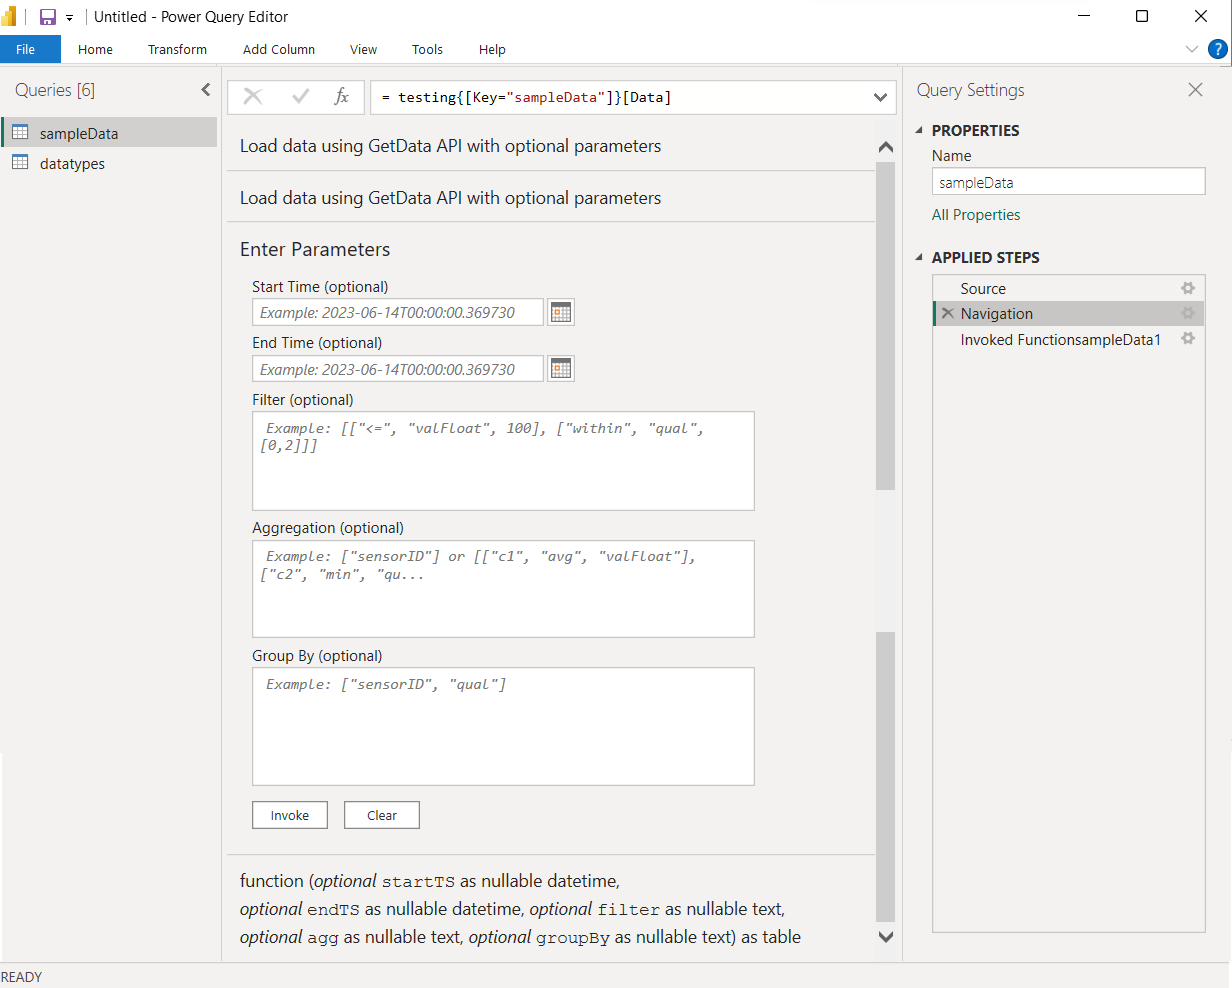
-
Click Invoke to submit the changes.
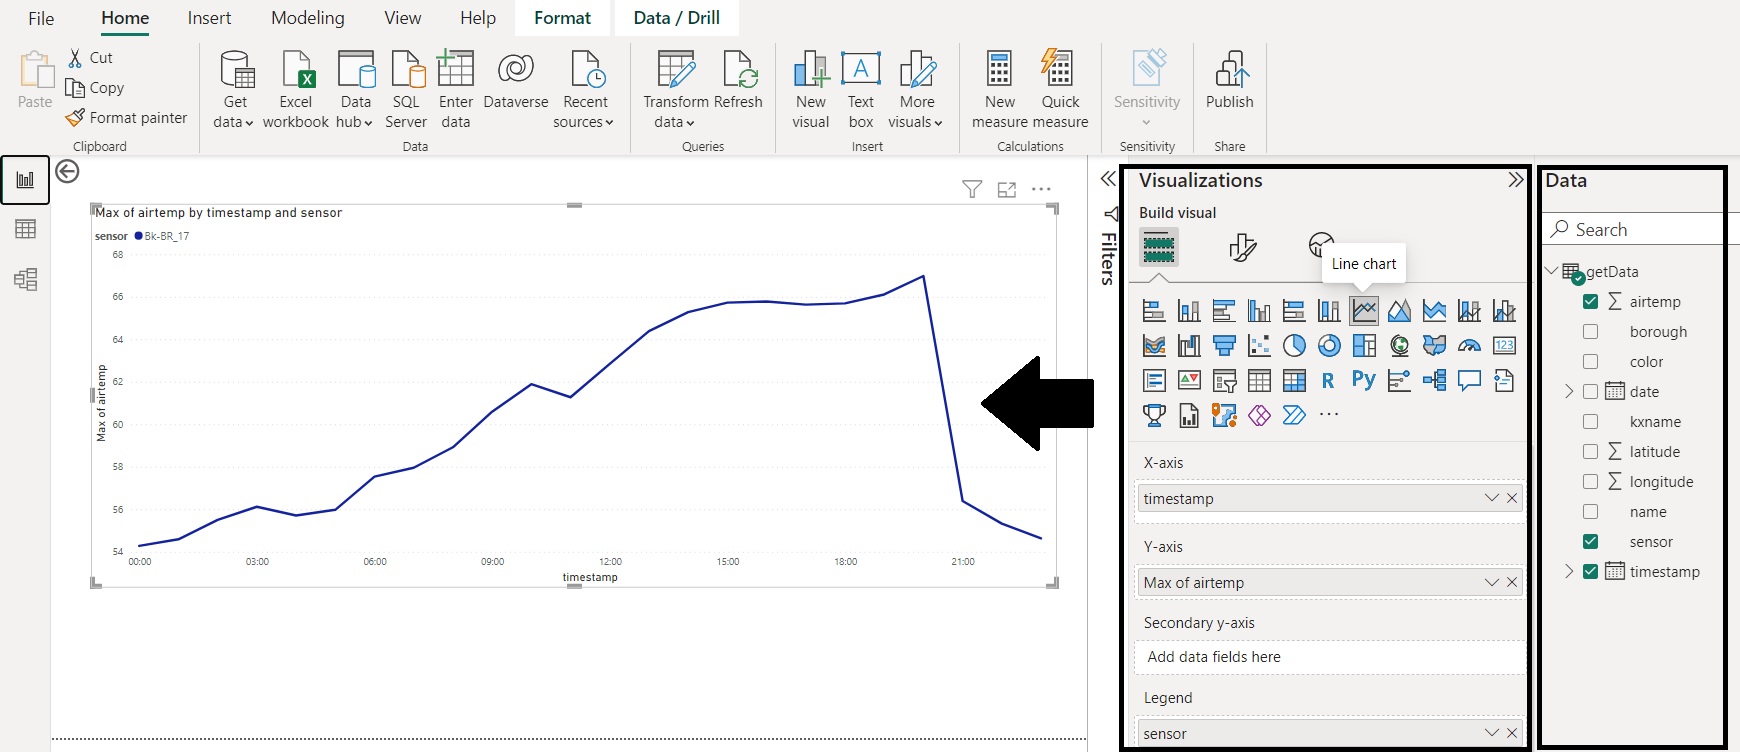
Analyzing data
To analyze the data once it is loaded:
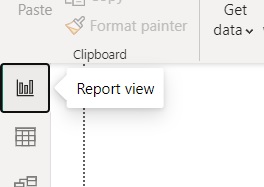
-
On the left sidebar, select the Report view graph icon.
-
Under Visualizations, select the icon for the type of chart and enter the data for each axis.
Summary
As seen above, with just a few clicks you can import kdb Insights Enterprise data directly into Power BI using the certified KX kdb Insights Enterprise Power Query Connector.
By integrating kdb Insights Enterprise data directly into the report creation experience we are making it easier than ever to access, analyze, and collaborate on data.