kdb Insights Enterprise Alerts and Notifications
This page explains how to enable or disable the set of pre-configured alerts to help you monitor and maintain the health of your kdb Insights Enterprise activity on Azure Marketplace.
Getting started
-
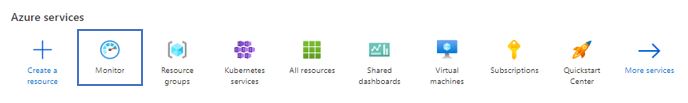
Go to Azure Homepage and click Monitor.
-
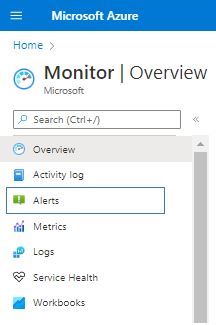
On the left-hand panel, click Alerts.
-
On the top panel, click Alert rules.
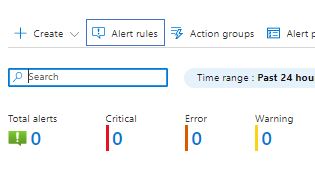
The Alert rules section shows the full list of pre-packaged alerts kdb Insights Enterprise provides you. For the Customer Managed Plan, by default, those alerts are pre-configured with the kdb Insights Enterprise recommended thresholds however they are in a disabled state so that you can decide whether to enable them. This is because there is a cost associated with this Azure service. The following guide details how you can edit any status, notification type and threshold value if you choose to enable an Alert.
Note
For the kdb Insights Enterprise KX Managed App Plan, these Alerts are enabled by default and are required by the kdb Insights Enterprise Managed Service Team to provide Support. Customers should not edit or disable Alerts in a kdb Insights Enterprise Managed deployment.
Alerts deployed with the system
List of alerts and their triggering thresholds automatically deployed with kdb Insights Enterprise.
|
name |
description |
default threshold |
|---|---|---|
|
quota limit |
Creates the service limit or quota request for the specified resource. |
no default |
|
create or update logger |
Creates a logger or Updates an existing logger. |
no default |
|
delete logger |
Deletes the specified logger. |
no default |
|
CPU Percentage |
Aggregated average CPU utilization measured in percentage across the cluster. |
Two separate alerts, one threshold ≥ 80% and another one for threshold ≥ 90% |
|
disk Percentage |
Disk space used in percentage by device. |
Two separate alerts, one threshold ≥ 80% and another one for threshold 90% |
|
failed pod |
Count of failed pods by controller, namespace, node and phase. |
if > 0 |
|
OOM killed containers |
Count of OOM (Out of Memory) killed containers by controllers, kubernetes namespace. |
if > 0 |
|
EOD process complete |
Completion of End of Day process. This is an informative alert. |
if ≥ 1 |
|
PostgreSQL container failed |
PostgreSQL container which supports Keycloak is no longer running. |
if = 1 |
|
keycloak pod down |
Pod responsible for Keycloak has failed. |
if = 1 |
|
crash loop back off detected |
A CrashLoopBackOff has been detected (a pod is failing to restart successfully). |
if ≥ 1 |
|
rook ceph percentage |
Aggregated average rook-ceph utilization measured in percentage across the cluster. Only deployed if rook-ceph is deployed. |
Two separate alerts, one threshold if > 80% and another one for threshold > 90% |
|
rook ceph MB |
Amount of free space in rook ceph (MB) across the cluster. Only deployed if rook-ceph is deployed. |
if < 2000 MB |
|
rook ceph health status |
Ceph health status metric: healthy, warning, error. Only deployed if rook-ceph is deployed. If this metric returns something different from 1 (healthy), the cluster is having critical issues which must be investigated. |
if ≠ healthy |
|
invalid access request |
There has been 3 failed access attempts in the past 10 minutes. |
if > 3 |
|
kdb stream processor failure |
The Stream Processor component has failed or been manually stopped. |
if = 1 |
|
node not in Ready state |
A node appears to not be in a ready state. |
if ≥ 1 |
|
pod in unknown state |
A pod state has not been obtained. |
if ≥ 1 |
|
rt container down |
RT container has either failed or been manually stopped. |
if = 1 |
|
storage manager failure |
The Storage Manager container has failed or been manually stopped. |
if = 1 |
|
non RT pv percentage |
A PV connected to one or multiple pods has surpassed the threshold value from its total capacity. Specific to non-RT PV's. |
Two separate alerts, one threshold if > 60% and another one for threshold 80% |
|
RT pv percentage |
PV for RT pods has reached 93% of its total capacity. Specific for RT PV's. |
if > 93% |
|
License Expiring |
Kx License has not renewed after the 7th day and has less than 3 days until expiry - Check for failures. |
if > 0 |
|
License Renew Error |
There is an error in the kx license renewal job - act immediately. |
if > 0 |
|
High Aggregated Errors |
Aggregator errors for the last minute. |
if > 20 |
|
High Aggregated Queue Size |
Aggregator request queue size for the last minute |
if > 20 |
|
High SM EOD Time |
Time take for an EOD |
if > 4h |
|
SM No Records Written During EOI |
An End of Interval ran but no records were written |
if = 0 |
|
No DAPs Present |
At Least one database is deployed, but no Resource Coordinator DAPs exist |
if = 0 |
|
Pod Not Ready |
Pod in NotReady state for the last minute |
if > 0 |
|
Pod in CrashLoopBackOff |
Pod failing to restart on for the last minute |
if > 0 |
|
High RC Retries |
Resource Coordinator Request retries |
if > 20 |
|
RCs Without DAPs |
Resource Coordinators have connected licnets but there are no Data Access Processes connected to them |
if > 0 |
|
No RDB Growth |
Rate of RDB Growth is 0% |
if = 0 |
|
High SG Pending Queries |
Service Gateway pending queries for the last minute are high |
if > 20 |
|
No active RT Leader |
There is no leader for the Stream and therefore no messages will be merged and available for the subscribers |
if > 0 |
|
No EOI Records |
An End of Interval ran but no records were written |
if = 0 |
|
RC Queue Size |
Resource Coordinator queue size is growing |
if > 20 |
Enable or disable alerts
Once you have accessed Alert rules:
-
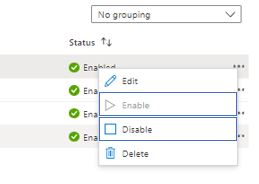
Find the alert you want to change the status for
-
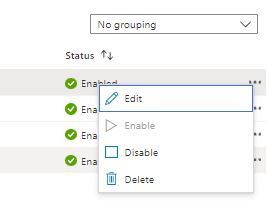
Click on the "..." next to Status.
-
Select whether to Enable or Disable it.
Modify notification
Once you have accessed Alert rules:
-
Find the alert you want to change the notification type for.
-
Click on the "..." next to Status.
-
Select Edit.
-
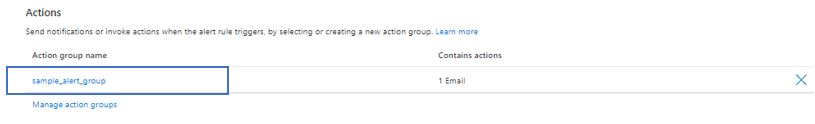
A new screen opens, scroll down until you find Actions.
-
Click on the Action Group.
-
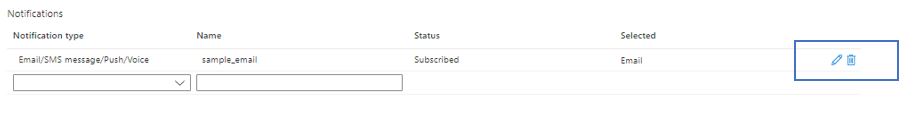
A new screen opens, scroll down until you find Notifications.
-
Under Notification type, find the element to modify.
-
Select the pencil.
-
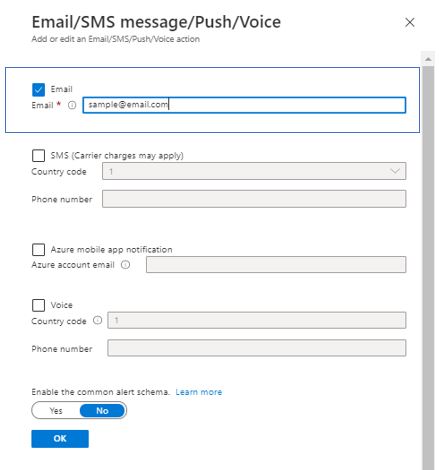
A new screen opens, update the information and click OK.
-
Click on Save Changes.
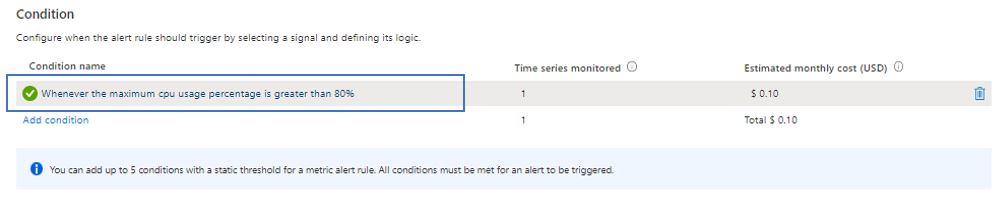
Modify threshold
Once you have accessed Alert rules
-
Click on the alert to modify.
-
A new screen opens, scroll down until you find Condition.
-
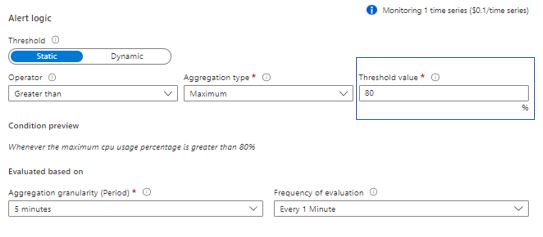
Click on the name of the alert.
-
A new screen opens, scroll down until you find Threshold Value, modify it.
-
Click Done.
-
Click Save.