Open KX Dashboards
This page describes what you see when you open KX Dashboards, introduces the Demo Dashboards and provides links to getting started building your own Dashboards.
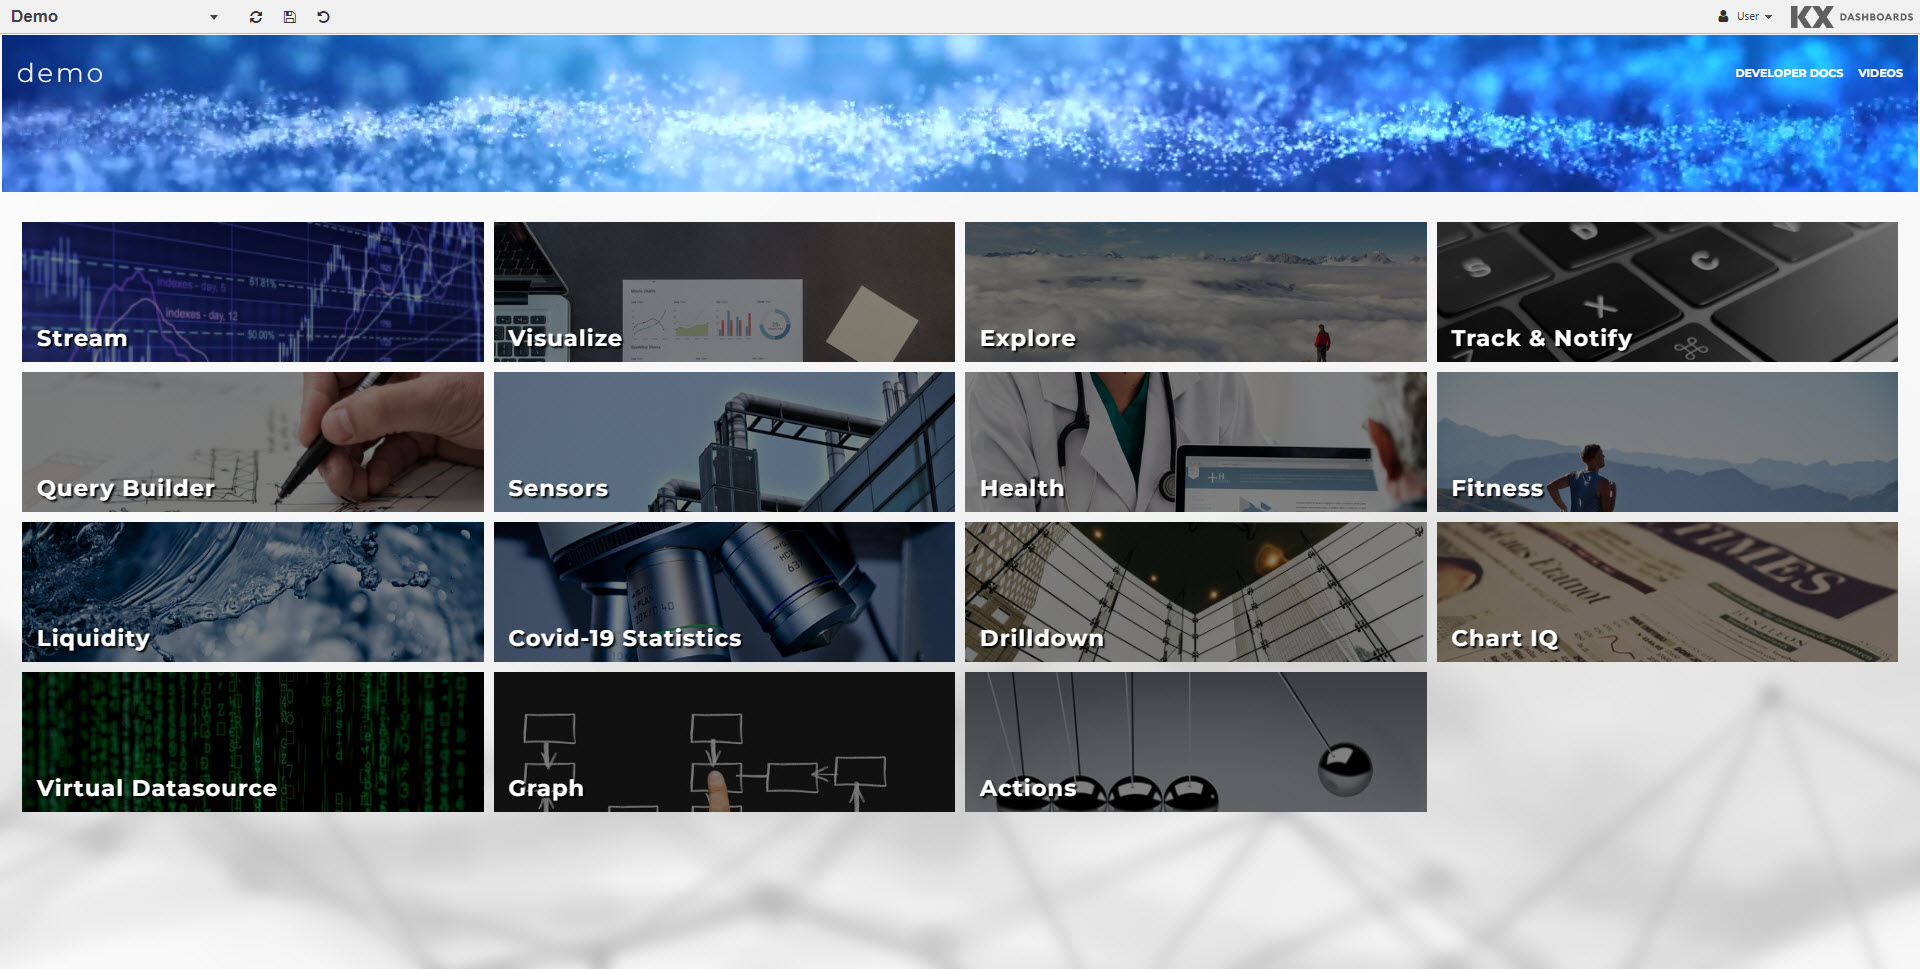
Once KX Dashboards is installed and run it starts with a Demo page in Viewer mode. Refer to Demo Dashboards for details about these demos.
To enable the dashboard editor, insert /edit/ between the URL and #dashboard reference.
This opens the workspace, in Design mode, allowing you to create your own dashboard using the menu options.
-
Drag a component, such as a Data Grid, from the left and arrange on the central workspace.
-
Configure the components properties, on the right-hand panel. For example set a Data Source to view data
-
Add a Data Form component and link it using View States.
-
Continue adding components and setting properties to build, style and share interactive visualizations.
-
When you are finished configuring you dashboard Publish it.