Manage Highlight Rules
This page describes Highlight rules which are a common property utilizing color or icon markers, or both, to notify users of value changes and are best used with real-time streaming or polling data.
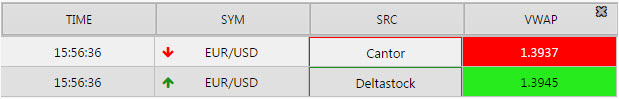
Highlight rules in operation in a Data Grid
Canvas Chart, Data Grid, Pie Chart
Build a rule

|
Field |
Description |
||||||||||||||||||||||
|---|---|---|---|---|---|---|---|---|---|---|---|---|---|---|---|---|---|---|---|---|---|---|---|
|
Name |
Assign a name for your rule |
||||||||||||||||||||||
|
Target |
The Data Source column updated when the rule is true |
||||||||||||||||||||||
|
Condition Source |
The Data Source column monitored by the Condition Operator against the Condition Value |
||||||||||||||||||||||
|
Condition Operator |
May be a numeric comparison, but can also test for strings in text values
|
||||||||||||||||||||||
|
Condition Value |
Typically |
||||||||||||||||||||||
|
Color |
Text color changed by rule when true |
||||||||||||||||||||||
|
Background Color |
Data Grid cell background or Canvas Chart bar or point changed by rule when true |
||||||||||||||||||||||
|
Border Color |
Data Grid cell border or Canvas Chart bar or point border changed by rule when true |
||||||||||||||||||||||
|
Icon |
|
||||||||||||||||||||||
|
Icon Color |
For Data Grid, icon appears when rule is true. |
Gradient

Gradient highlight rule applied to bubble and bar canvas chart
Set a gradient color using Color Palette with a range defined by Rule Min and Rule Max